
Page 415 - The Veterinary Laboratory and Field Manual 3rd Edition
P. 415
384 Susan C. Cork
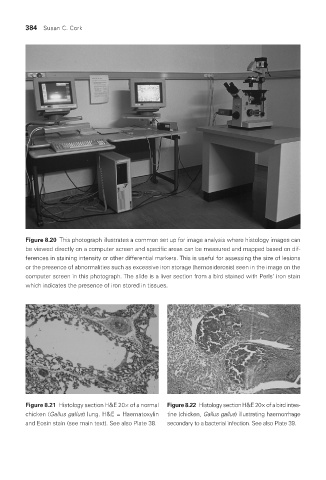
Figure 8.20 This photograph illustrates a common set up for image analysis where histology images can
be viewed directly on a computer screen and specific areas can be measured and mapped based on dif-
ferences in staining intensity or other differential markers. This is useful for assessing the size of lesions
or the presence of abnormalities such as excessive iron storage (hemosiderosis) seen in the image on the
computer screen in this photograph. The slide is a liver section from a bird stained with Perls’ iron stain
which indicates the presence of iron stored in tissues.
Figure 8.21 Histology section H&E 20× of a normal Figure 8.22 Histology section H&E 20× of a bird intes-
chicken (Gallus gallus) lung. H&E = Haematoxylin tine (chicken, Gallus gallus) illustrating haemorrhage
and Eosin stain (see main text). See also Plate 38. secondary to a bacterial infection. See also Plate 39.
Vet Lab.indb 384 26/03/2019 10:26