
Page 43 - Clinical Small Animal Internal Medicine
P. 43
2 Statistical Interpretation for Practitioners 11
Table 2.1 Commonly used parametric and equivalent nonparametric statistical tests in biomedical research.
VetBooks.ir Types of data Type of statistical problem Parametric test Nonparametric test
Continuous Two independent samples Student’s t Wilcoxon‐Mann‐Whitney
Two dependent samples Paired t Wilcoxon signed rank
Three or more independent samples Analysis of variance Kruskal‐Wallis
(one‐way)
Three or more ordered independent Jonckheere‐Terpstra
samples
Categorical Unordered 2 × 2 table Fisher’s exact
Unordered R × C table a Pearson’s Chi‐square
Single ordered R × C table a Kruskal‐Wallis
Doubly ordered R × C table a Jonckheere‐Terpstra
Two dependent samples McNemar’s (two levels)
Marginal homogeneity
(three or more levels)
K independent ordered proportions b Cochran‐Armitage trend
K dependent samples Repeated measures analysis of
variance (one‐way) Friedman
Ordinal Association of two samples Pearson correlation Spearman correlation
a R = number of rows, C = number of columns.
b K = number of proportions or samples, K > 2.
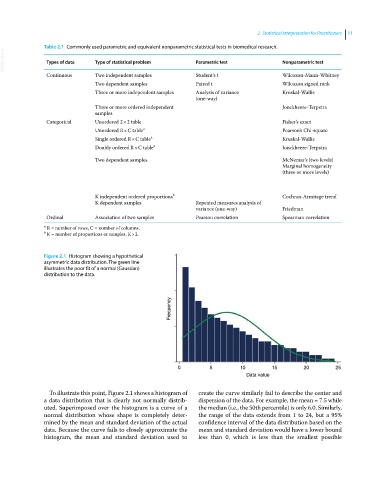
Figure 2.1 Histogram showing a hypothetical
asymmetric data distribution. The green line
illustrates the poor fit of a normal (Gaussian)
distribution to the data.
Frequency
0 5 10 15 20 25
Data value
To illustrate this point, Figure 2.1 shows a histogram of create the curve similarly fail to describe the center and
a data distribution that is clearly not normally distrib- dispersion of the data. For example, the mean = 7.5 while
uted. Superimposed over the histogram is a curve of a the median (i.e., the 50th percentile) is only 6.0. Similarly,
normal distribution whose shape is completely deter- the range of the data extends from 1 to 24, but a 95%
mined by the mean and standard deviation of the actual confidence interval of the data distribution based on the
data. Because the curve fails to closely approximate the mean and standard deviation would have a lower bound
histogram, the mean and standard deviation used to less than 0, which is less than the smallest possible