
Page 45 - Clinical Small Animal Internal Medicine
P. 45
2 Statistical Interpretation for Practitioners 13
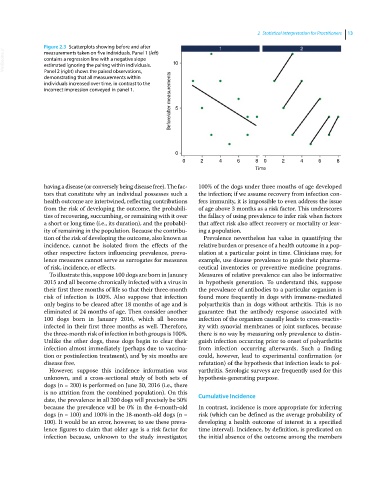
Figure 2.3 Scatterplots showing before and after 1 2
VetBooks.ir contains a regression line with a negative slope 10
measurements taken on five individuals. Panel 1 (left)
estimated ignoring the pairing within individuals.
Panel 2 (right) shows the paired observations,
Before/after measurements 5
demonstrating that all measurements within
individuals increased over time, in contrast to the
incorrect impression conveyed in panel 1.
0
0 2 4 6 8 0 2 4 6 8
Time
having a disease (or conversely being disease free). The fac- 100% of the dogs under three months of age developed
tors that constitute why an individual possesses such a the infection; if we assume recovery from infection con-
health outcome are intertwined, reflecting contributions fers immunity, it is impossible to even address the issue
from the risk of developing the outcome, the probabili- of age above 3 months as a risk factor. This underscores
ties of recovering, succumbing, or remaining with it over the fallacy of using prevalence to infer risk when factors
a short or long time (i.e., its duration), and the probabil- that affect risk also affect recovery or mortality or leav-
ity of remaining in the population. Because the contribu- ing a population.
tion of the risk of developing the outcome, also known as Prevalence nevertheless has value in quantifying the
incidence, cannot be isolated from the effects of the relative burden or presence of a health outcome in a pop-
other respective factors influencing prevalence, preva- ulation at a particular point in time. Clinicians may, for
lence measures cannot serve as surrogates for measures example, use disease prevalence to guide their pharma-
of risk, incidence, or effects. ceutical inventories or preventive medicine programs.
To illustrate this, suppose 100 dogs are born in January Measures of relative prevalence can also be informative
2015 and all become chronically infected with a virus in in hypothesis generation. To understand this, suppose
their first three months of life so that their three‐month the prevalence of antibodies to a particular organism is
risk of infection is 100%. Also suppose that infection found more frequently in dogs with immune‐mediated
only begins to be cleared after 18 months of age and is polyarthritis than in dogs without arthritis. This is no
eliminated at 24 months of age. Then consider another guarantee that the antibody response associated with
100 dogs born in January 2016, which all become infection of the organism causally leads to cross‐reactiv-
infected in their first three months as well. Therefore, ity with synovial membranes or joint surfaces, because
the three‐month risk of infection in both groups is 100%. there is no way by measuring only prevalence to distin-
Unlike the other dogs, these dogs begin to clear their guish infection occurring prior to onset of polyarthritis
infection almost immediately (perhaps due to vaccina- from infection occurring afterwards. Such a finding
tion or postinfection treatment), and by six months are could, however, lead to experimental confirmation (or
disease free. refutation) of the hypothesis that infection leads to pol-
However, suppose this incidence information was yarthritis. Serologic surveys are frequently used for this
unknown, and a cross‐sectional study of both sets of hypothesis‐generating purpose.
dogs (n = 200) is performed on June 30, 2016 (i.e., there
is no attrition from the combined population). On this Cumulative Incidence
date, the prevalence in all 200 dogs will precisely be 50%
because the prevalence will be 0% in the 6‐month‐old In contrast, incidence is more appropriate for inferring
dogs (n = 100) and 100% in the 18‐month‐old dogs (n = risk (which can be defined as the average probability of
100). It would be an error, however, to use these preva- developing a health outcome of interest in a specified
lence figures to claim that older age is a risk factor for time interval). Incidence, by definition, is predicated on
infection because, unknown to the study investigator, the initial absence of the outcome among the members