
Page 12 - COPR-Feb2018
P. 12
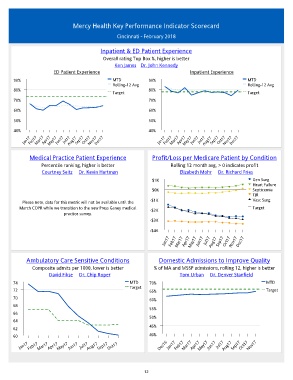
Mercy Health Key Performance Indicator Scorecard


                                                  Cincinnati - February 2018

                                           Inpatient & ED Patient Experience
                                            Overall rating Top Box %, higher is better
                                                 Ken James     Dr. John Kennedy
                       ED Patient Experience                                    Inpatient Experience
       90%                                      MTD            90%                                       MTD
                                                Rolling-12 Avg                                           Rolling-12 Avg
       80%                                                     80%
                                                Target                                                   Target
       70%                                                     70%

       60%                                                     60%

       50%                                                     50%
       40%                                                     40%
           Jan17  Feb17  Mar17  Apr17 May17  Jun17  Jul17 Aug17  Sep17  Oct17 Nov17 Dec17  Jan17  Feb17  Mar17  Apr17 May17  Jun17  Jul17 Aug17  Sep17  Oct17 Nov17 Dec17


             Medical Practice Patient Experience                 Profit/Loss per Medicare Patient by Condition
                  Percentile ranking, higher is better                  Rolling 12 month avg, > 0 indicates profit
                    Courtney Seitz     Dr. Kevin Hartman                      Elizabeth Mohr     Dr. Richard Fries
                                                                 $1K                                       Gen Surg
                                                                                                           Heart Failure
                                                                 $0K                                       Septicemia
                                                                                                           TJR
          Please note, data for this metric will not be available until the   -$1K                         Vasc Surg
         March COPR while we transition to the new Press Ganey medical   -$2K                              Target
                            practice survey.
                                                                -$3K
                                                                -$4K
                                                                      Jan17  Feb17  Mar17  Apr17  May17  Jun17  Jul17  Aug17  Sep17  Oct17  Nov17  Dec17


            Ambulatory Care Sensitive Conditions                   Domestic Admissions to Improve Quality
              Composite admits per 1000, lower is better         % of MA and MSSP admissions, rolling 12, higher is better
                       David Fikse     Dr. Chip Roper                         Tom Urban     Dr. Denver Stanfield
       74                                              MTD     70%                                              MTD
       72                                              Target  65%                                              Target
       70                                                      60%
       68
                                                               55%
       66
                                                               50%
       64
                                                               45%
       62
       60                                                      40%
         Jan17  Feb17  Mar17  Apr17 May17  Jun17  Jul17 Aug17  Sep17  Oct17  Dec16  Jan17  Feb17  Mar17  Apr17  May17  Jun17  Jul17  Aug17  Sep17  Oct17  Nov17


                                                             12