
Page 242 - Six Sigma Advanced Tools for Black Belts and Master Black Belts
P. 242
OTE/SPH
OTE/SPH
Char Count= 0
August 31, 2006
JWBK119-15
3:4
Moisture Soak Model 227
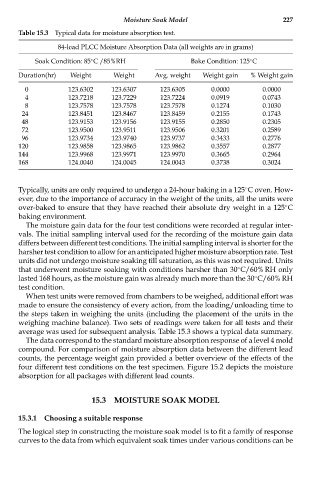
Table 15.3 Typical data for moisture absorption test.
84-lead PLCC Moisture Absorption Data (all weights are in grams)
Soak Condition: 85 C /85%RH Bake Condition: 125 C
◦
◦
Duration(hr) Weight Weight Avg. weight Weight gain % Weight gain
0 123.6302 123.6307 123.6305 0.0000 0.0000
4 123.7218 123.7229 123.7224 0.0919 0.0743
8 123.7578 123.7578 123.7578 0.1274 0.1030
24 123.8451 123.8467 123.8459 0.2155 0.1743
48 123.9153 123.9156 123.9155 0.2850 0.2305
72 123.9500 123.9511 123.9506 0.3201 0.2589
96 123.9734 123.9740 123.9737 0.3433 0.2776
120 123.9858 123.9865 123.9862 0.3557 0.2877
144 123.9968 123.9971 123.9970 0.3665 0.2964
168 124.0040 124.0045 124.0043 0.3738 0.3024
Typically, units are only required to undergo a 24-hour baking in a 125 C oven. How-
◦
ever, due to the importance of accuracy in the weight of the units, all the units were
over-baked to ensure that they have reached their absolute dry weight in a 125 C
◦
baking environment.
The moisture gain data for the four test conditions were recorded at regular inter-
vals. The initial sampling interval used for the recording of the moisture gain data
differs between different test conditions. The initial sampling interval is shorter for the
harsher test condition to allow for an anticipated higher moisture absorption rate. Test
units did not undergo moisture soaking till saturation, as this was not required. Units
◦
that underwent moisture soaking with conditions harsher than 30 C/60% RH only
lasted 168 hours, as the moisture gain was already much more than the 30 C/60% RH
◦
test condition.
When test units were removed from chambers to be weighed, additional effort was
made to ensure the consistency of every action, from the loading/unloading time to
the steps taken in weighing the units (including the placement of the units in the
weighing machine balance). Two sets of readings were taken for all tests and their
average was used for subsequent analysis. Table 15.3 shows a typical data summary.
The data correspond to the standard moisture absorption response of a level 4 mold
compound. For comparison of moisture absorption data between the different lead
counts, the percentage weight gain provided a better overview of the effects of the
four different test conditions on the test specimen. Figure 15.2 depicts the moisture
absorption for all packages with different lead counts.
15.3 MOISTURE SOAK MODEL
15.3.1 Choosing a suitable response
The logical step in constructing the moisture soak model is to fit a family of response
curves to the data from which equivalent soak times under various conditions can be