
Page 250 - Six Sigma Advanced Tools for Black Belts and Master Black Belts
P. 250
OTE/SPH
OTE/SPH
Char Count= 0
3:4
August 31, 2006
JWBK119-15
Discussion 235
hand, it is possible that the difference in results can be due to the use of different mold
compounds and some variations in the experimental process. It is widely believed
that moisture absorption is dependent on the mold compound property, the amount
of compound encapsulated for package, die attach epoxy, packaging construction. For
different types of packaging, the moisture content of a package is dependent on the
temperature and humidity. Nevertheless, from Figure 15.2, it is observed that the de-
pendency on temperature is more pronounced. In particular, at 60%RH, the moisture
absorption tends to be a linear function of temperature after an initial phase of rapid
gain.
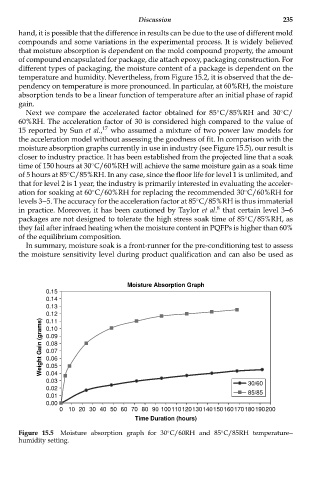
Next we compare the accelerated factor obtained for 85 C/85%RH and 30 C/
◦
◦
60%RH. The acceleration factor of 30 is considered high compared to the value of
15 reported by Sun et al., 17 who assumed a mixture of two power law models for
the acceleration model without assessing the goodness of fit. In comparison with the
moisture absorption graphs currently in use in industry (see Figure 15.5), our result is
closer to industry practice. It has been established from the projected line that a soak
time of 150 hours at 30 C/60%RH will achieve the same moisture gain as a soak time
◦
of 5 hours at 85 C/85%RH. In any case, since the floor life for level 1 is unlimited, and
◦
that for level 2 is 1 year, the industry is primarily interested in evaluating the acceler-
ation for soaking at 60 C/60%RH for replacing the recommended 30 C/60%RH for
◦
◦
levels 3--5. The accuracy for the acceleration factor at 85 C/85%RH is thus immaterial
◦
8
in practice. Moreover, it has been cautioned by Taylor et al. that certain level 3--6
packages are not designed to tolerate the high stress soak time of 85 C/85%RH, as
◦
they fail after infraed heating when the moisture content in PQFPs is higher than 60%
of the equilibrium composition.
In summary, moisture soak is a front-runner for the pre-conditioning test to assess
the moisture sensitivity level during product qualification and can also be used as
Moisture Absorption Graph
0.15
0.14
0.13
0.12
0.11
Weight Gain (grams) 0.09
0.10
0.08
0.07
0.06
0.05
0.04
0.03 30/60
0.02
0.01 85/85
0.00
0 10 20 30 40 50 60 70 80 90 100 110 120130 140150 160170 180190200
Time Duration (hours)
Figure 15.5 Moisture absorption graph for 30 C/60RH and 85 C/85RH temperature--
◦
◦
humidity setting.