Page 268 - Six Sigma Advanced Tools for Black Belts and Master Black Belts
P. 268

OTE/SPH
 OTE/SPH
                         3:5
                              Char Count= 0
 JWBK119-16
          August 31, 2006
                                     Robust Design                           253
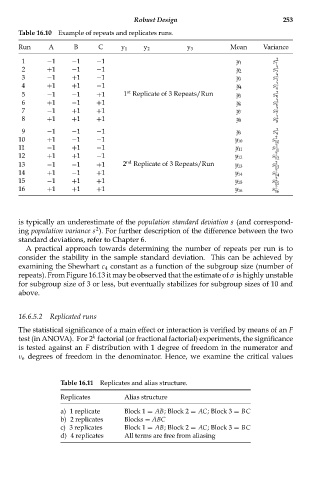
      Table 16.10 Example of repeats and replicates runs.
      Run     A      B      C     y 1   y 2         y 3        Mean     Variance
       1      −1    −1     −1                                    y 1       s 1 2
       2      +1    −1     −1                                              s  2
                                                                 y 2
                                                                           2
       3      −1    +1     −1                                              s  2
                                                                 y 3
                                                                           3
       4      +1    +1     −1                                              s  2
                                                                 y 4
                                                                           4
                                   st
       5      −1    −1     +1     1 Replicate of 3 Repeats/Run             s  2
                                                                 y 5
                                                                           5
       6      +1    −1     +1                                              s  2
                                                                 y 6
                                                                           6
       7      −1    +1     +1                                              s 2
                                                                 y 7
                                                                           7
       8      +1    +1     +1                                              s 2
                                                                 y 8
                                                                           8
       9      −1    −1     −1                                              s 2
                                                                 y 9
                                                                           9
      10      +1    −1     −1                                              s 2
                                                                y 10
                                                                           10
      11      −1    +1     −1                                              s 2
                                                                 y 11
                                                                           11
                                                                           2
      12      +1    +1     −1                                   y 12       s 12
                                                                           2
      13      −1    −1     +1     2 nd  Replicate of 3 Repeats/Run  y 13   s 13
                                                                           2
      14      +1    −1     +1                                   y 14       s 14
                                                                           2
      15      −1    +1     +1                                   y 15       s 15
                                                                           2
      16      +1    +1     +1                                   y 16       s 16
      is typically an underestimate of the population standard deviation s (and correspond-
                           2
      ing population variance s ). For further description of the difference between the two
      standard deviations, refer to Chapter 6.
        A practical approach towards determining the number of repeats per run is to
      consider the stability in the sample standard deviation. This can be achieved by
      examining the Shewhart c 4 constant as a function of the subgroup size (number of
      repeats). From Figure 16.13 it may be observed that the estimate of σ is highly unstable
      for subgroup size of 3 or less, but eventually stabilizes for subgroup sizes of 10 and
      above.
      16.6.5.2 Replicated runs
      The statistical significance of a main effect or interaction is verified by means of an F
                          k
      test (in ANOVA). For 2 factorial (or fractional factorial) experiments, the significance
      is tested against an F distribution with 1 degree of freedom in the numerator and
      ν e degrees of freedom in the denominator. Hence, we examine the critical values
                 Table 16.11 Replicates and alias structure.
                 Replicates        Alias structure
                 a) 1 replicate    Block 1 = AB; Block 2 = AC; Block 3 = BC
                 b) 2 replicates   Blocks = ABC
                 c) 3 replicates   Block 1 = AB; Block 2 = AC; Block 3 = BC
                 d) 4 replicates   All terms are free from aliasing
   263   264   265   266   267   268   269   270   271   272   273