
Page 269 - Six Sigma Advanced Tools for Black Belts and Master Black Belts
P. 269
OTE/SPH
OTE/SPH
August 31, 2006
3:5
JWBK119-16
Char Count= 0
254 A Glossary for Design of Experiments with Examples
Shewhart c Constant vs Sub-Group Size
4
12
10
Shewhart c 4 Constant 08
06
04
02
00
0 5 10 15 20 25
Sub-Group Size
Figure 16.13 Graphical illustration of Shewhart c 4 constant vs. the subgroup size.
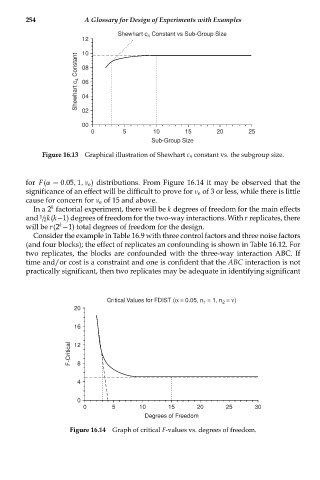
for F(α = 0.05, 1,ν e ) distributions. From Figure 16.14 it may be observed that the
significance of an effect will be difficult to prove for ν e of 3 or less, while there is little
cause for concern for ν e of 15 and above.
k
In a 2 factorial experiment, there will be k degrees of freedom for the main effects
and / 2k(k−1) degrees of freedom for the two-way interactions. With r replicates, there
1
k
will be r(2 −1) total degrees of freedom for the design.
Consider the example in Table 16.9 with three control factors and three noise factors
(and four blocks); the effect of replicates an confounding is shown in Table 16.12. For
two replicates, the blocks are confounded with the three-way interaction ABC. If
time and/or cost is a constraint and one is confident that the ABC interaction is not
practically significant, then two replicates may be adequate in identifying significant
Critical Values for FDIST (α = 0.05, n = 1, n = ν)
2
1
20
16
F-Critical 12 8
4
0
0 5 10 15 20 25 30
Degrees of Freedom
Figure 16.14 Graph of critical F-values vs. degrees of freedom.