
Page 265 - Six Sigma Advanced Tools for Black Belts and Master Black Belts
P. 265
OTE/SPH
OTE/SPH
August 31, 2006
3:5
JWBK119-16
Char Count= 0
250 A Glossary for Design of Experiments with Examples
Table 16.8 Design resolution and respective orders aliased effects.
Resolution Smallest sum of order of aliased effects
III Main effects + 2-way interactions
IV Main effects + 3-way interactions; 2-way interactions + 2-way interactions
V Main effects + 4-way interactions; 2-way interactions + 3-way interactions
VI Main effects + 5-way interactions; 2-way interactions + 3-way interactions;
3-way interactions + 2-way interactions
16.5.4 Design resolution
The resolution of a two-level fractional factorial design is the smallest sum of the
orders of aliased effects (see Table 16.8) To avoid confounding of two-way interactions,
which is quite common in reality, Resolution III designs should be avoided whenever
possible, while designs of Resolution V and above are preferred.
16.6 ROBUST DESIGN
16.6.1 Loss function
Quality is the loss imparted to the society from the time a product is shipped. (Genichi Taguchi)
A loss function is a mathematical relationship between loss (however it may be defined)
and a selected performance characteristic.
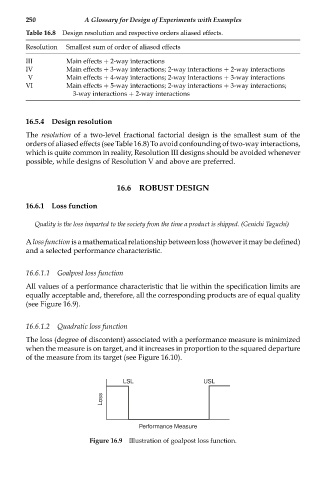
16.6.1.1 Goalpost loss function
All values of a performance characteristic that lie within the specification limits are
equally acceptable and, therefore, all the corresponding products are of equal quality
(see Figure 16.9).
16.6.1.2 Quadratic loss function
The loss (degree of discontent) associated with a performance measure is minimized
when the measure is on target, and it increases in proportion to the squared departure
of the measure from its target (see Figure 16.10).
LSL USL
Loss
Performance Measure
Figure 16.9 Illustration of goalpost loss function.