
Page 260 - Six Sigma Advanced Tools for Black Belts and Master Black Belts
P. 260
OTE/SPH
OTE/SPH
3:5
August 31, 2006
JWBK119-16
Char Count= 0
Types of Factorial Experiments 245
Table 16.3 Example of split-plot design.
Std order Run order Factor A Factor B Factor C
1 4 −1 −1 −1
2 2 +1 −1 −1
3 3 −1 +1 −1
4 1 +1 +1 −1
5 5 −1 −1 +1
6 8 +1 −1 +1
7 7 −1 +1 +1
8 6 +1 +1 +1
nested in B. Since both suppliers may be run on each of the three lines, factors A and
B are said to be crossed.Ifa nested design is analyzed as a crossed design, the calculated
MS Error is typically higher than the actual MS Error , resulting in under-recognition of
the effects.
16.4.3 Split-plot designs
3
Consider the 2 factorial design in Table 16.3. Here, factor C is maintained at a given
level (−1), while factors A and B are randomized within that level of C (runs 1--4).
Factor C is then changed to the other level (+1), while factors A and B are randomized
(runs 5--8).
If a split-plot design is analyzed as a crossed design, the calculated MS Error is typically
lower than the actual MS Error , resulting in over-recognition of the effects.
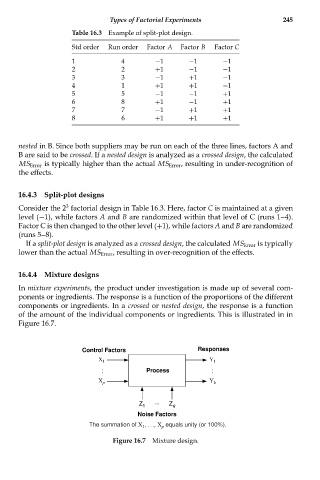
16.4.4 Mixture designs
In mixture experiments, the product under investigation is made up of several com-
ponents or ingredients. The response is a function of the proportions of the different
components or ingredients. In a crossed or nested design, the response is a function
of the amount of the individual components or ingredients. This is illustrated in in
Figure 16.7.
Control Factors Responses
X 1 Y 1
: Process :
X p Y k
...
Z 1 Z q
Noise Factors
The summation of X , ..., X equals unity (or 100%).
p
1
Figure 16.7 Mixture design.