
Page 257 - Six Sigma Advanced Tools for Black Belts and Master Black Belts
P. 257
OTE/SPH
OTE/SPH
Char Count= 0
August 31, 2006
3:5
JWBK119-16
242 A Glossary for Design of Experiments with Examples
16.2 ANALYSIS OF FACTORIAL DESIGNS
16.2.1 Response function
3
Fora2 factorial design, the full model response function is defined by
Y = μ + A i.. + B . j. + C ..k + AB ij. + AC i.k + BC . jk + ABC ijk + ε.
The statistical significance of a main effect or interaction may be verified by analysis
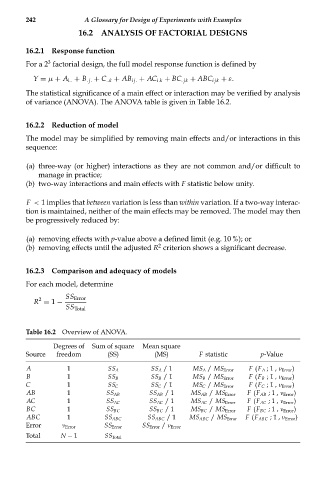
of variance (ANOVA). The ANOVA table is given in Table 16.2.
16.2.2 Reduction of model
The model may be simplified by removing main effects and/or interactions in this
sequence:
(a) three-way (or higher) interactions as they are not common and/or difficult to
manage in practice;
(b) two-way interactions and main effects with F statistic below unity.
F < 1 implies that between variation is less than within variation. If a two-way interac-
tion is maintained, neither of the main effects may be removed. The model may then
be progressively reduced by:
(a) removing effects with p-value above a defined limit (e.g. 10 %); or
2
(b) removing effects until the adjusted R criterion shows a significant decrease.
16.2.3 Comparison and adequacy of models
For each model, determine
2 SS Error
R = 1 −
SS Total
Table 16.2 Overview of ANOVA.
Degrees of Sum of square Mean square
Source freedom (SS) (MS) F statistic p-Value
A 1 SS A SS A /1 MS A / MS Error F (F A ;1, ν Error )
B 1 SS B SS B /1 MS B / MS Error F (F B ;1, ν Error )
C 1 SS C SS C /1 MS C / MS Error F (F C ;1, ν Error )
AB 1 SS AB SS AB /1 MS AB / MS Error F (F AB ;1, ν Error )
AC 1 SS AC SS AC /1 MS AC / MS Error F (F AC ;1, ν Error )
BC 1 SS BC SS BC /1 MS BC / MS Error F (F BC ;1, ν Error )
ABC 1 SS ABC SS ABC /1 MS ABC / MS Error F (F ABC ;1, ν Error )
Error ν Error SS Error SS Error / ν Error
Total N − 1 SS Total