
Page 256 - Six Sigma Advanced Tools for Black Belts and Master Black Belts
P. 256
OTE/SPH
OTE/SPH
3:5
August 31, 2006
JWBK119-16
Char Count= 0
Factorial Designs 241
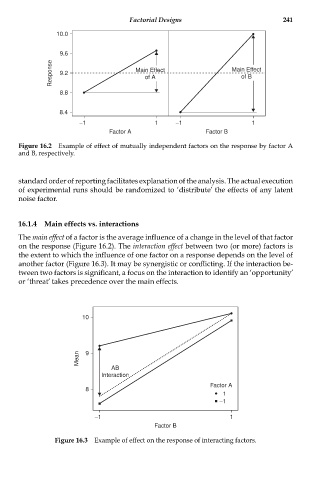
10.0
9.6
Response 9.2 Main Effect Main Effect
of B
of A
8.8
8.4
−1 1 −1 1
Factor A Factor B
Figure 16.2 Example of effect of mutually independent factors on the response by factor A
and B, respectively.
standard order of reporting facilitates explanation of the analysis. The actual execution
of experimental runs should be randomized to ‘distribute’ the effects of any latent
noise factor.
16.1.4 Main effects vs. interactions
The main effect of a factor is the average influence of a change in the level of that factor
on the response (Figure 16.2). The interaction effect between two (or more) factors is
the extent to which the influence of one factor on a response depends on the level of
another factor (Figure 16.3). It may be synergistic or conflicting. If the interaction be-
tween two factors is significant, a focus on the interaction to identify an ‘opportunity’
or ‘threat’ takes precedence over the main effects.
10
Mean 9
AB
Interaction
Factor A
8
1
−1
−1 1
Factor B
Figure 16.3 Example of effect on the response of interacting factors.