
Page 315 - Six Sigma Advanced Tools for Black Belts and Master Black Belts
P. 315
OTE/SPH
OTE/SPH
August 31, 2006
Char Count= 0
JWBK119-19
300 3:6 Economical Experimentation via ‘Lean Design’
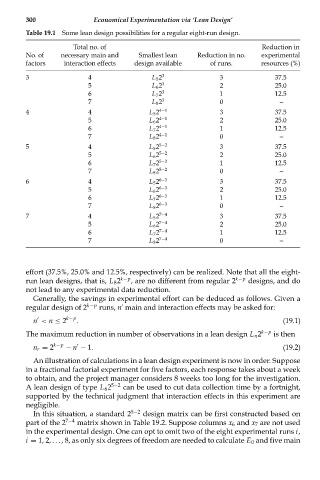
Table 19.1 Some lean design possibilities for a regular eight-run design.
Total no. of Reduction in
No. of necessary main and Smallest lean Reduction in no. experimental
factors interaction effects design available of runs. resources (%)
3 4 L 5 2 3 3 37.5
5 L 6 2 3 2 25.0
6 L 7 2 3 1 12.5
7 L 8 2 3 0 --
4 4 L 5 2 4−1 3 37.5
5 L 6 2 4−1 2 25.0
6 L 7 2 4−1 1 12.5
7 L 8 2 4−1 0 --
5 4 L 5 2 5−2 3 37.5
5 L 6 2 5−2 2 25.0
6 L 7 2 5−2 1 12.5
7 L 8 2 5−2 0 --
6 4 L 5 2 6−3 3 37.5
5 L 6 2 6−3 2 25.0
6 L 7 2 6−3 1 12.5
7 L 8 2 6−3 0 --
7 4 L 5 2 7−4 3 37.5
5 L 6 2 7−4 2 25.0
6 L 7 2 7−4 1 12.5
7 L 8 2 7−4 0 --
effort (37.5%, 25.0% and 12.5%, respectively) can be realized. Note that all the eight-
run lean designs, that is, L 8 2 k−p , are no different from regular 2 k−p designs, and do
not lead to any experimental data reduction.
Generally, the savings in experimental effort can be deduced as follows. Given a
regular design of 2 k−p runs, n main and interaction effects may be asked for:
n < n ≤ 2 k−p . (19.1)
The maximum reduction in number of observations in a lean design L n 2 k−p is then
n r = 2 k−p − n − 1. (19.2)
An illustration of calculations in a lean design experiment is now in order. Suppose
in a fractional factorial experiment for five factors, each response takes about a week
to obtain, and the project manager considers 8 weeks too long for the investigation.
A lean design of type L 6 2 5−2 can be used to cut data collection time by a fortnight,
supported by the technical judgment that interaction effects in this experiment are
negligible.
In this situation, a standard 2 5−2 design matrix can be first constructed based on
part of the 2 7−4 matrix shown in Table 19.2. Suppose columns x 6 and x 7 are not used
in the experimental design. One can opt to omit two of the eight experimental runs i,
i = 1, 2, . . . , 8, as only six degrees of freedom are needed to calculate E 0 and five main