
Page 391 - Six Sigma Advanced Tools for Black Belts and Master Black Belts
P. 391
OTE/SPH
OTE/SPH
3:8
August 31, 2006
JWBK119-24
Char Count= 0
376 Cumulative Sum Charts with Fast Initial Response
Table 24.1 FIR CUSUM example: initially-out-of-control case; h = 5, k = 0.5 (from Table 5,
11
Lucas and Crosier ).
CUSUM +
i
Tabular V-mask
i No FIR FIR No FIR FIR
0 -- 0.0 2.5 0 0
1 0.8 0.3 2.8 0.8 3.3
2 1.9 1.7 4.2 2.7 5.2
3 1.4 2.6 5.1** 4.1 6.6
4 2.0 4.1 6.6** 6.1 8.6
5 1.1 4.7 7.2** 7.2 9.7
6 0.7 4.9 7.4** 7.9 10.4
7 2.6 7.0* 9.5** 10.5 13.0
*CUSUM out-of-control signal.
**FIR CUSUM out-of-control signal.
Tabular CUSUM V-mask CUSUM
8 12
6 4 10
Cumulative Sum 2 0 Cumulative Sum 8 6 4
−2
−4 2
−6 0
0 2 4 6 8 0 2 4 6 8 10 12 14 16 18
Sample Sample
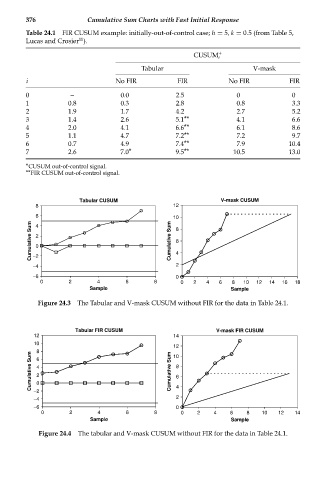
Figure 24.3 The Tabular and V-mask CUSUM without FIR for the data in Table 24.1.
Tabular FIR CUSUM V-mask FIR CUSUM
12 14
10
12
8
Cumulative Sum 6 4 2 0 Cumulative Sum 8 6
10
−2
−4 4 2
−6 0
0 2 4 6 8 0 2 4 6 8 10 12 14
Sample Sample
Figure 24.4 The tabular and V-mask CUSUM without FIR for the data in Table 24.1.