
Page 392 - Six Sigma Advanced Tools for Black Belts and Master Black Belts
P. 392
OTE/SPH
OTE/SPH
August 31, 2006
3:8
Char Count= 0
JWBK119-24
Fast Initial Response 377
24.2.3 CUSUM n
From the above it is clear that if the FIR V-mask scheme is used for a two-sided test,
two charts are needed: one for checking for an increase and another one for a decrease
12
n
in the mean. As an alternative, Atienza et al. proposed the CUSUM , to combine the
two charts into one.
Note that equations (24.5) and (24.6) differ only by the FIR at i = 1. By subtracting
the FIR from (24.5) and adding the same value to (24.6), we have
c
⎨ 0 , i = 0,
⎧
n i
CUSUM = (24.7)
i x i , i > 0,
⎩
j=1
where
−FIR, for CUSUM ,
+
0
c 0 = (24.8)
FIR, for CUSUM .
−
0
Thus, by using (24.7) and (24.8), we can use the typical CUSUM mask and an out-of-
control situation will be signaled when c 0 is outside the mask arms. Atienza et al. 12
showed that (with simulated data), this procedure is applicable to all CUSUM mask
forms.
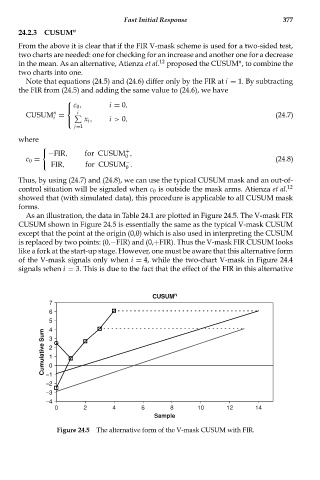
As an illustration, the data in Table 24.1 are plotted in Figure 24.5. The V-mask FIR
CUSUM shown in Figure 24.5 is essentially the same as the typical V-mask CUSUM
except that the point at the origin (0,0) which is also used in interpreting the CUSUM
is replaced by two points: (0,−FIR) and (0,+FIR). Thus the V-mask FIR CUSUM looks
like a fork at the start-up stage. However, one must be aware that this alternative form
of the V-mask signals only when i = 4, while the two-chart V-mask in Figure 24.4
signals when i = 3. This is due to the fact that the effect of the FIR in this alternative
CUSUM n
7
6
5
4
Cumulative Sum 3
2
1
0
−1
−2
−3
−4
0 2 4 6 8 10 12 14
Sample
Figure 24.5 The alternative form of the V-mask CUSUM with FIR.