
Page 388 - Six Sigma Advanced Tools for Black Belts and Master Black Belts
P. 388
OTE/SPH
OTE/SPH
3:8
Char Count= 0
August 31, 2006
JWBK119-24
Introduction 373
where y i is the ith sample reading with zero mean and unit variance and n represents
the number of samples. At any time point i = n, we have n CUSUMs. These may
fluctuate about the horizontal direction μ 0 = 0 even when the process is on target.
9
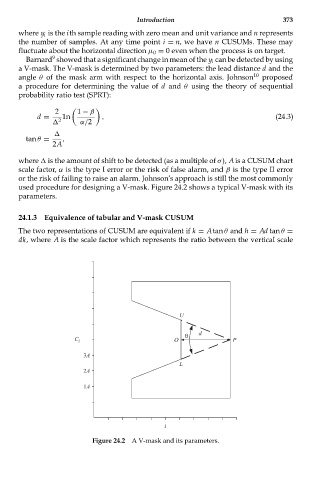
Barnard showed that a significant change in mean of the y i can be detected by using
a V-mask. The V-mask is determined by two parameters: the lead distance d and the
angle θ of the mask arm with respect to the horizontal axis. Johnson 10 proposed
a procedure for determining the value of d and θ using the theory of sequential
probability ratio test (SPRT):
2 1 − β
d = 1n , (24.3)
2 α/2
tan θ = ,
2A
where is the amount of shift to be detected (as a multiple of σ), Ais a CUSUM chart
scale factor, α is the type I error or the risk of false alarm, and β is the type II error
or the risk of failing to raise an alarm. Johnson’s approach is still the most commonly
used procedure for designing a V-mask. Figure 24.2 shows a typical V-mask with its
parameters.
24.1.3 Equivalence of tabular and V-mask CUSUM
The two representations of CUSUM are equivalent if k = Atan θ and h = Ad tan θ =
dk, where A is the scale factor which represents the ratio between the vertical scale
U
θ d
C i O P
3A
L
2A
1A
i
Figure 24.2 A V-mask and its parameters.