
Page 383 - Six Sigma Advanced Tools for Black Belts and Master Black Belts
P. 383
OTE/SPH
OTE/SPH
August 31, 2006
Char Count= 0
3:8
JWBK119-23
368 Statistical Process Control for Autocorrelated Processes
ARL ARL
400 400
AR 1 = 0.0 AR 1 = 0.5
300 300
SCC
200 Max Lambda 200
Avg Lambda
100 100
0 0
0 0.5 1 1.5 2 2.5 3 0 0.5 1 1.5 2 2.5 3
SHIFT in MEAN SHIFT in MEAN
ARL ARL
400 400
AR 1 = 0.75 AR 1 = 0.9
300 300
200 200
100 100
0 0
0 0.5 1 1.5 2 2.5 3 0 0.5 1 1.5 2 2.5 3
SHIFT in MEAN SHIFT in MEAN
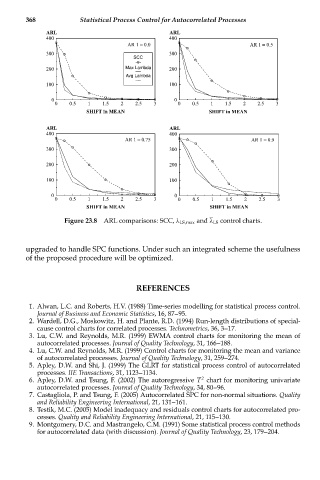
Figure 23.8 ARL comparisons: SCC, λ LS,max and λ LS control charts.
upgraded to handle SPC functions. Under such an integrated scheme the usefulness
of the proposed procedure will be optimized.
REFERENCES
1. Alwan, L.C. and Roberts, H.V. (1988) Time-series modelling for statistical process control.
Journal of Business and Economic Statistics, 16, 87--95.
2. Wardell, D.G., Moskowitz, H. and Plante, R.D. (1994) Run-length distributions of special-
cause control charts for correlated processes. Technometrics, 36, 3--17.
3. Lu, C.W. and Reynolds, M.R. (1999) EWMA control charts for monitoring the mean of
autocorrelated processes. Journal of Quality Technology, 31, 166--188.
4. Lu, C.W. and Reynolds, M.R. (1999) Control charts for monitoring the mean and variance
of autocorrelated processes. Journal of Quality Technology, 31, 259--274.
5. Apley, D.W. and Shi, J. (1999) The GLRT for statistical process control of autocorrelated
processes. IIE Transactions, 31, 1123--1134.
2
6. Apley, D.W. and Tsung, F. (2002) The autoregressive T chart for monitoring univariate
autocorrelated processes. Journal of Quality Technology, 34, 80--96.
7. Castagliola, P. and Tsung, F. (2005) Autocorrelated SPC for non-normal situations. Quality
and Reliability Engineering International, 21, 131--161.
8. Testik, M.C. (2005) Model inadequacy and residuals control charts for autocorrelated pro-
cesses. Quality and Reliability Engineering International, 21, 115--130.
9. Montgomery, D.C. and Mastrangelo, C.M. (1991) Some statistical process control methods
for autocorrelated data (with discussion). Journal of Quality Technology, 23, 179--204.