
Page 179 - Microsoft Word - LessonPlan-Overview.doc
P. 179
they would like to. Information
you collect during your experiment
is called data.
Data from our smog experiment,
collected from the website
http://www.statemaster.com/grap
h/hea_pre_of_ast-health-
prevalence-of-asthma would tell us
that both California and Wyoming
have asthma rates of 7.6%.
You don’t have to surf the web to
find data: you might set up an
experiment that gives you data as
well. (We’ll learn more about how
to do this later in the unit.)
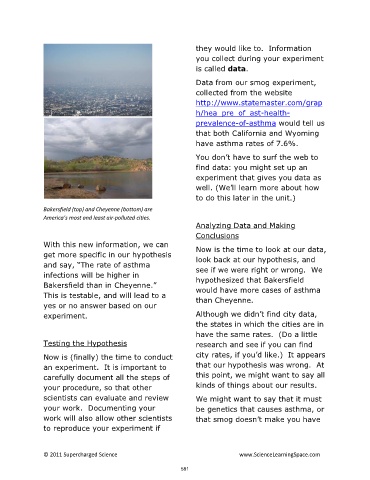
Bakersfield (top) and Cheyenne (bottom) are
America’s most and least air-polluted cities.
Analyzing Data and Making
Conclusions
With this new information, we can
Now is the time to look at our data,
get more specific in our hypothesis
look back at our hypothesis, and
and say, “The rate of asthma
see if we were right or wrong. We
infections will be higher in
hypothesized that Bakersfield
Bakersfield than in Cheyenne.”
would have more cases of asthma
This is testable, and will lead to a
than Cheyenne.
yes or no answer based on our
experiment. Although we didn’t find city data,
the states in which the cities are in
have the same rates. (Do a little
Testing the Hypothesis research and see if you can find
Now is (finally) the time to conduct city rates, if you’d like.) It appears
an experiment. It is important to that our hypothesis was wrong. At
carefully document all the steps of this point, we might want to say all
your procedure, so that other kinds of things about our results.
scientists can evaluate and review We might want to say that it must
your work. Documenting your be genetics that causes asthma, or
work will also allow other scientists that smog doesn’t make you have
to reproduce your experiment if
© 2011 Supercharged Science www.ScienceLearningSpace.com
581