
Page 52 - TX_Marketing 2_M1_v2
P. 52
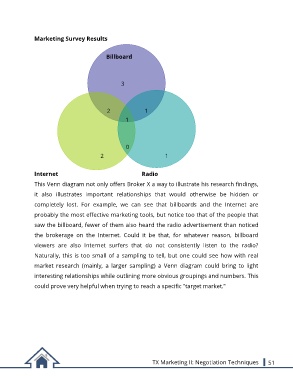
Marketing Survey Results


                                                  Billboard


                                                            3


                                              2               1
                                                                            1


                                                      0

                                           2                          1

               Internet                                                        Radio

               This Venn diagram not only offers Broker X a way to illustrate his research findings,

               it  also  illustrates  important  relationships  that  would  otherwise  be  hidden  or
               completely  lost.  For  example,  we  can  see  that  billboards  and  the  Internet  are

               probably the most effective marketing tools, but notice too that of the people that

               saw the billboard, fewer of them also heard the radio advertisement than noticed
               the  brokerage  on  the  Internet.  Could  it  be  that,  for  whatever  reason,  billboard

               viewers  are  also  Internet  surfers  that  do  not  consistently  listen  to  the  radio?

               Naturally, this is too small of a sampling to tell, but one could see how with real
               market  research  (mainly,  a  larger  sampling)  a  Venn  diagram  could  bring  to  light

               interesting relationships while outlining more obvious groupings and numbers. This

               could prove very helpful when trying to reach a specific "target market."


                                                                 TX Marketing II: Negotiation Techniques         51