
Page 11 - ATT DEI Annual Report
P. 11
r
g
p
a
e
D
o
m
hi
on
C
.
t
s
c
(
)
k
or
f
e
W
Workforce Demographics (Cont.)
c
or
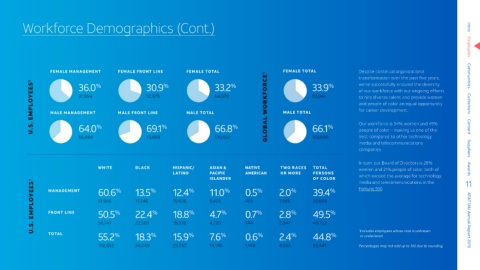
FEMALE MANAGEMENT FEMALE FRONT LINE % FEMALE TOTAL % FEMALE TOTAL % Despite continual organizational
transformation over the past five years,
U.S. EMPLOYEES 1 MALE MANAGEMENT MALE FRONT LINE MALE TOTAL 64,870 GLOBAL WORKFORCE 1 MALE TOTAL 83,941 of our workforce with our ongoing efforts Intro Employees Communities Customers Content Suppliers Awards
33.9
30.9
36.0
33.2
we’ve successfully ensured the diversity
%
32,876
31,994
to hire diverse talent and provide women
and people of color an equal opportunity
for career development.
64.0
%
%
%
people of color – making us one of the
best compared to other technology,
56,884 % 69.1 66.8 66.1 Our workforce is 34% women and 45%
163,846
130,552
73,668
media and telecommunications
companies.
In turn, our Board of Directors is 28%
WHITE BLACK HISPANIC/ ASIAN & NATIVE TWO RACES TOTAL women and 21% people of color, both of
LATINO PACIFIC AMERICAN OR MORE PERSONS
ISLANDER 0.5 2.0 OF COLOR which exceed the average for technology, 11
media and telecommunications in the
U.S. EMPLOYEES 1 FRONT LINE 51,905 % 11,546 % 10,626 % 9,425 % 405 % 1,686 % 33,688 % AT&T D&I Annual Report 2019
11.0
Fortune 500.
13.5
39.4
60.6
12.4
%
%
%
%
%
%
%
MANAGEMENT
2.8
50.5
22.4
0.7
4.7
49.5
18.8
49,753
50,747
18,939
744
4,720
22,503
2,847
Excludes employees whose race is unknown
0.6
15.9
7.6
18.3
44.8
55.2
2.4
TOTAL
%
%
%
%
%
%
%
1 or undeclared.
102,652 34,049 29,565 14,145 1,149 4,533 83,441 Percentages may not add up to 100 due to rounding.