Page 223 - Department of Social Development Annual Report 2021
P. 223

PART D: HUMAN RESOURCE MANAGEMENT

             HUMAN RESOURCE OVERSIGHT STATISTICS


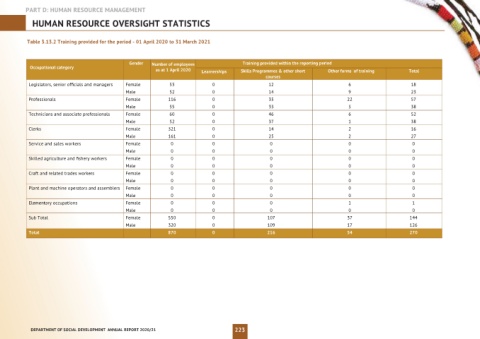
           Table 3.13.2 Training provided for the period - 01 April 2020 to 31 March 2021


                                              Gender  Number of employees             Training provided within the reporting period
           Occupational category                        as at 1 April 2020  Learnerships  Skills Programmes & other short   Other forms  of training  Total
                                                                                              courses
           Legislators, senior officials and managers  Female  53           0                   12                          6                     18
                                             Male           52             0                   14                          9                     23
           Professionals                     Female         116            0                   35                          22                    57
                                             Male           55             0                   33                          5                     38
           Technicians and associate professionals  Female  60             0                   46                          6                     52
                                             Male           52             0                   37                          1                     38
           Clerks                            Female         321            0                   14                          2                     16
                                             Male           161            0                   25                          2                     27
           Service and sales workers         Female          0             0                    0                          0                      0
                                             Male            0             0                    0                          0                      0
           Skilled agriculture and fishery workers  Female    0             0                    0                          0                      0
                                             Male            0             0                    0                          0                      0
           Craft and related trades workers  Female          0             0                    0                          0                      0
                                             Male            0             0                    0                          0                      0
           Plant and machine operators and assemblers  Female  0           0                    0                          0                      0
                                             Male            0             0                    0                          0                      0
           Elementary occupations            Female          0             0                    0                          1                      1
                                             Male            0             0                    0                          0                      0
           Sub Total                         Female         550            0                   107                         37                    144
                                             Male           320            0                   109                         17                    126
           Total                                            870            0                   216                         54                    270


            DEPARTMENT OF SOCIAL DEVELOPMENT  ANNUAL REPORT 2020/21                223
   218   219   220   221   222   223   224   225   226   227   228