
Page 15 - Y1—CCEP Research 2019-2020
P. 15
EYES INC—CCEP Yearly Report for 2019-2020 — Version 0.3 June 22, 2020
7 Intervention Design
7.1 Intervention Calendar
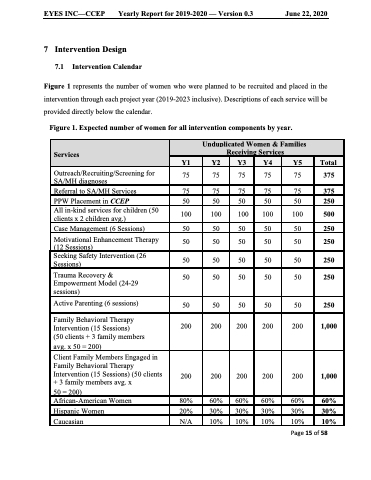
Figure 1 represents the number of women who were planned to be recruited and placed in the intervention through each project year (2019-2023 inclusive). Descriptions of each service will be provided directly below the calendar.
Figure 1. Expected number of women for all intervention components by year.
Services
Unduplicated Women & Families Receiving Services
Y1
Y2
Y3
Y4
Y5
Total
Outreach/Recruiting/Screening for SA/MH diagnoses
Referral to SA/MH Services PPW Placement in CCEP
All in-kind services for children (50 clients x 2 children avg.)
Case Management (6 Sessions)
Motivational Enhancement Therapy (12 Sessions)
Seeking Safety Intervention (26 Sessions)
Active Parenting (6 sessions)
75 75 75
75 75 75 50 50 50
75 75 375 75 75 375
50 50 250 100 100 100 100 100 500
50 50 50 50 50 50
50 50 50
50 50 50
50 50 250 50 50 250
50 50 250
50 50 250
Trauma Recovery & Empowerment Model (24-29 sessions)
50
50
50
50
50
250
Family Behavioral Therapy Intervention (15 Sessions)
(50 clients + 3 family members
avg. x 50 = 200)
200
200
200
200
200
1,000
Client Family Members Engaged in Family Behavioral Therapy Intervention (15 Sessions) (50 clients + 3 family members avg. x
50 = 200)
200
200
200
200
200
1,000
African-American Women Hispanic Women Caucasian
80% 60% 60% 20% 30% 30% N/A 10% 10%
60% 60% 60% 30% 30% 30% 10% 10% 10%
Page 15 of 58
