
Page 154 - Quantitative Data Analysis
P. 154
Quantitative Data Analysis
Simply Explained Using SPSS
with 18 df
2
2
t = F. thus, (3.8666) = 14.95 (that is the F ratio, obtained earlier)
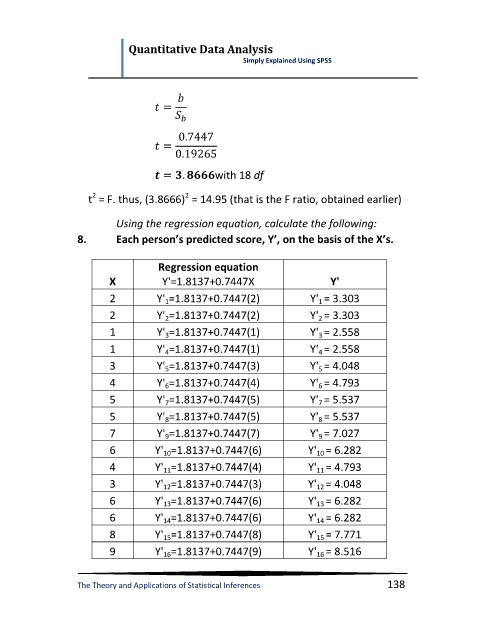
Using the regression equation, calculate the following:
8. Each person’s predicted score, Y’, on the basis of the X’s.
Regression equation
X Y'=1.8137+0.7447X Y'
2 Y' 1=1.8137+0.7447(2) Y' 1 = 3.303
2 Y' 2=1.8137+0.7447(2) Y' 2 = 3.303
1 Y' 3=1.8137+0.7447(1) Y' 3 = 2.558
1 Y' 4=1.8137+0.7447(1) Y' 4 = 2.558
3 Y' 5=1.8137+0.7447(3) Y' 5 = 4.048
4 Y' 6=1.8137+0.7447(4) Y' 6 = 4.793
5 Y' 7=1.8137+0.7447(5) Y' 7 = 5.537
5 Y' 8=1.8137+0.7447(5) Y' 8 = 5.537
7 Y' 9=1.8137+0.7447(7) Y' 9 = 7.027
6 Y' 10=1.8137+0.7447(6) Y' 10 = 6.282
4 Y' 11=1.8137+0.7447(4) Y' 11 = 4.793
3 Y' 12=1.8137+0.7447(3) Y' 12 = 4.048
6 Y' 13=1.8137+0.7447(6) Y' 13 = 6.282
6 Y' 14=1.8137+0.7447(6) Y' 14 = 6.282
8 Y' 15=1.8137+0.7447(8) Y' 15 = 7.771
9 Y' 16=1.8137+0.7447(9) Y' 16 = 8.516
The Theory and Applications of Statistical Inferences 138