
Page 156 - Quantitative Data Analysis
P. 156
Quantitative Data Analysis
Simply Explained Using SPSS
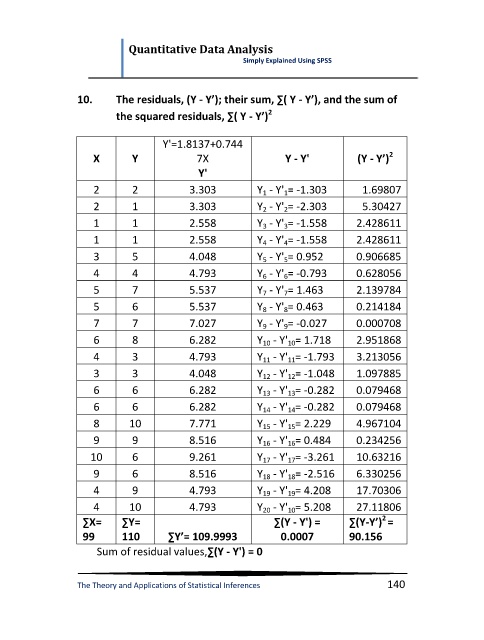
10. The residuals, (Y - Y’); their sum, ∑( Y - Y’), and the sum of
2
the squared residuals, ∑( Y - Y’)
Y'=1.8137+0.744
2
X Y 7X Y - Y' (Y - Y’)
Y'
2 2 3.303 Y 1 - Y' 1= -1.303 1.69807
2 1 3.303 Y 2 - Y' 2= -2.303 5.30427
1 1 2.558 Y 3 - Y' 3= -1.558 2.428611
1 1 2.558 Y 4 - Y' 4= -1.558 2.428611
3 5 4.048 Y 5 - Y' 5= 0.952 0.906685
4 4 4.793 Y 6 - Y' 6= -0.793 0.628056
5 7 5.537 Y 7 - Y' 7= 1.463 2.139784
5 6 5.537 Y 8 - Y' 8= 0.463 0.214184
7 7 7.027 Y 9 - Y' 9= -0.027 0.000708
6 8 6.282 Y 10 - Y' 10= 1.718 2.951868
4 3 4.793 Y 11 - Y' 11= -1.793 3.213056
3 3 4.048 Y 12 - Y' 12= -1.048 1.097885
6 6 6.282 Y 13 - Y' 13= -0.282 0.079468
6 6 6.282 Y 14 - Y' 14= -0.282 0.079468
8 10 7.771 Y 15 - Y' 15= 2.229 4.967104
9 9 8.516 Y 16 - Y' 16= 0.484 0.234256
10 6 9.261 Y 17 - Y' 17= -3.261 10.63216
9 6 8.516 Y 18 - Y' 18= -2.516 6.330256
4 9 4.793 Y 19 - Y' 19= 4.208 17.70306
4 10 4.793 Y 20 - Y' 10= 5.208 27.11806
2
∑X= ∑Y= ∑(Y - Y') = ∑(Y-Y’) =
99 110 ∑Y’= 109.9993 0.0007 90.156
Sum of residual values,∑(Y - Y') = 0
The Theory and Applications of Statistical Inferences 140