
Page 161 - Quantitative Data Analysis
P. 161
Quantitative Data Analysis
Simply Explained Using SPSS
Squared
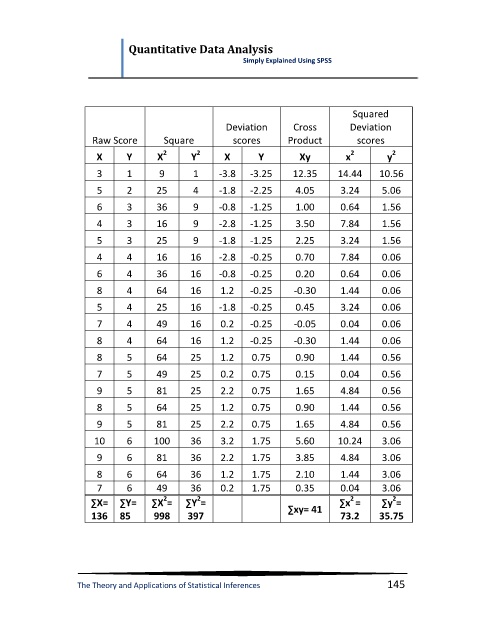
Deviation Cross Deviation
Raw Score Square scores Product scores
2
2
2
2
X Y X Y X Y Xy x y
3 1 9 1 -3.8 -3.25 12.35 14.44 10.56
5 2 25 4 -1.8 -2.25 4.05 3.24 5.06
6 3 36 9 -0.8 -1.25 1.00 0.64 1.56
4 3 16 9 -2.8 -1.25 3.50 7.84 1.56
5 3 25 9 -1.8 -1.25 2.25 3.24 1.56
4 4 16 16 -2.8 -0.25 0.70 7.84 0.06
6 4 36 16 -0.8 -0.25 0.20 0.64 0.06
8 4 64 16 1.2 -0.25 -0.30 1.44 0.06
5 4 25 16 -1.8 -0.25 0.45 3.24 0.06
7 4 49 16 0.2 -0.25 -0.05 0.04 0.06
8 4 64 16 1.2 -0.25 -0.30 1.44 0.06
8 5 64 25 1.2 0.75 0.90 1.44 0.56
7 5 49 25 0.2 0.75 0.15 0.04 0.56
9 5 81 25 2.2 0.75 1.65 4.84 0.56
8 5 64 25 1.2 0.75 0.90 1.44 0.56
9 5 81 25 2.2 0.75 1.65 4.84 0.56
10 6 100 36 3.2 1.75 5.60 10.24 3.06
9 6 81 36 2.2 1.75 3.85 4.84 3.06
8 6 64 36 1.2 1.75 2.10 1.44 3.06
7 6 49 36 0.2 1.75 0.35 0.04 3.06
2
2
2
2
∑X= ∑Y= ∑X = ∑Y = ∑xy= 41 ∑x = ∑y =
136 85 998 397 73.2 35.75
The Theory and Applications of Statistical Inferences 145