
Page 160 - Quantitative Data Analysis
P. 160
Quantitative Data Analysis
Simply Explained Using SPSS
Simple Regression Example # 4
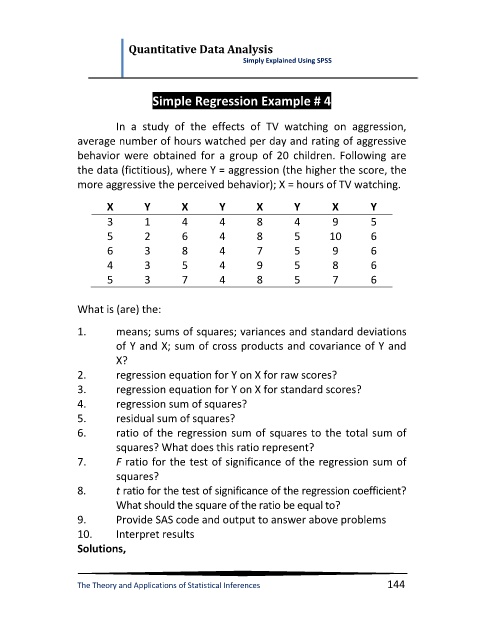
In a study of the effects of TV watching on aggression,
average number of hours watched per day and rating of aggressive
behavior were obtained for a group of 20 children. Following are
the data (fictitious), where Y = aggression (the higher the score, the
more aggressive the perceived behavior); X = hours of TV watching.
X Y X Y X Y X Y
3 1 4 4 8 4 9 5
5 2 6 4 8 5 10 6
6 3 8 4 7 5 9 6
4 3 5 4 9 5 8 6
5 3 7 4 8 5 7 6
What is (are) the:
1. means; sums of squares; variances and standard deviations
of Y and X; sum of cross products and covariance of Y and
X?
2. regression equation for Y on X for raw scores?
3. regression equation for Y on X for standard scores?
4. regression sum of squares?
5. residual sum of squares?
6. ratio of the regression sum of squares to the total sum of
squares? What does this ratio represent?
7. F ratio for the test of significance of the regression sum of
squares?
8. t ratio for the test of significance of the regression coefficient?
What should the square of the ratio be equal to?
9. Provide SAS code and output to answer above problems
10. Interpret results
Solutions,
The Theory and Applications of Statistical Inferences 144