
Page 155 - Quantitative Data Analysis
P. 155
Quantitative Data Analysis
Simply Explained Using SPSS
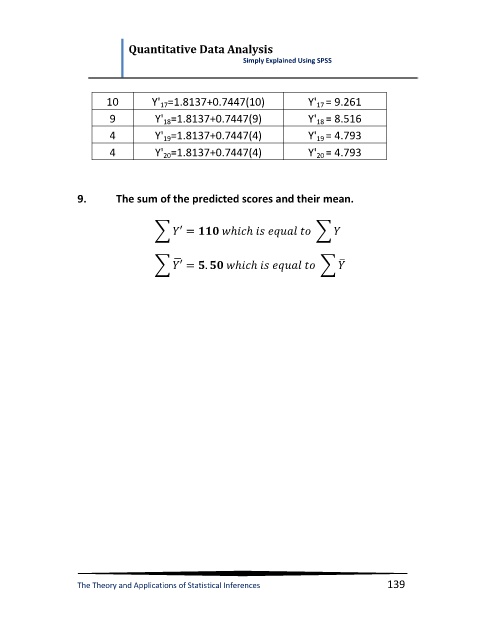
10 Y' 17=1.8137+0.7447(10) Y' 17 = 9.261
9 Y' 18=1.8137+0.7447(9) Y' 18 = 8.516
4 Y' 19=1.8137+0.7447(4) Y' 19 = 4.793
4 Y' 20=1.8137+0.7447(4) Y' 20 = 4.793
9. The sum of the predicted scores and their mean.
∑ ∑
̅
̅
∑ ∑
The Theory and Applications of Statistical Inferences 139