
Page 235 - Data Science Algorithms in a Week
P. 235
Managing Overcrowding in Healthcare using Fuzzy Logic 219
demand less than 1 and patient complexity less than 4, the surface appears to linearly
increase in a more predictable manner than the two step-like structures near its extremes.
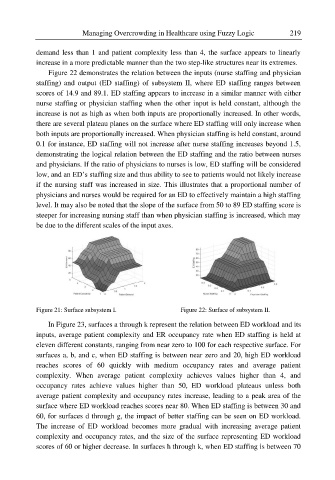
Figure 22 demonstrates the relation between the inputs (nurse staffing and physician
staffing) and output (ED staffing) of subsystem II, where ED staffing ranges between
scores of 14.9 and 89.1. ED staffing appears to increase in a similar manner with either
nurse staffing or physician staffing when the other input is held constant, although the
increase is not as high as when both inputs are proportionally increased. In other words,
there are several plateau planes on the surface where ED staffing will only increase when
both inputs are proportionally increased. When physician staffing is held constant, around
0.1 for instance, ED staffing will not increase after nurse staffing increases beyond 1.5,
demonstrating the logical relation between the ED staffing and the ratio between nurses
and physicians. If the ratio of physicians to nurses is low, ED staffing will be considered
low, and an ED’s staffing size and thus ability to see to patients would not likely increase
if the nursing staff was increased in size. This illustrates that a proportional number of
physicians and nurses would be required for an ED to effectively maintain a high staffing
level. It may also be noted that the slope of the surface from 50 to 89 ED staffing score is
steeper for increasing nursing staff than when physician staffing is increased, which may
be due to the different scales of the input axes.
Figure 21: Surface subsystem I. Figure 22: Surface of subsystem II.
In Figure 23, surfaces a through k represent the relation between ED workload and its
inputs, average patient complexity and ER occupancy rate when ED staffing is held at
eleven different constants, ranging from near zero to 100 for each respective surface. For
surfaces a, b, and c, when ED staffing is between near zero and 20, high ED workload
reaches scores of 60 quickly with medium occupancy rates and average patient
complexity. When average patient complexity achieves values higher than 4, and
occupancy rates achieve values higher than 50, ED workload plateaus unless both
average patient complexity and occupancy rates increase, leading to a peak area of the
surface where ED workload reaches scores near 80. When ED staffing is between 30 and
60, for surfaces d through g, the impact of better staffing can be seen on ED workload.
The increase of ED workload becomes more gradual with increasing average patient
complexity and occupancy rates, and the size of the surface representing ED workload
scores of 60 or higher decrease. In surfaces h through k, when ED staffing is between 70