
Page 238 - Data Science Algorithms in a Week
P. 238
222 Abdulrahman Albar, Ahmad Elshennawy, Mohammed Basingab et al.
demand and ED workload scores. ED crowding level scores achieved values between 25
and 75. To further study the variation in scores between observations, the scores were
plotted in Figure 25.
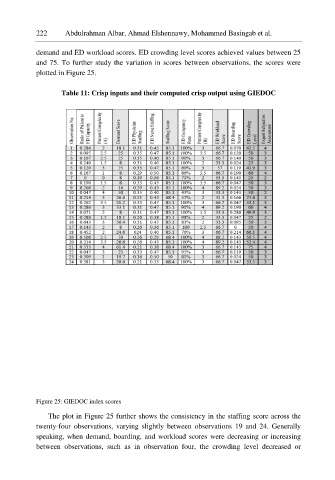
Table 11: Crisp inputs and their computed crisp output using GIEDOC
Figure 25: GIEDOC index scores
The plot in Figure 25 further shows the consistency in the staffing score across the
twenty-four observations, varying slightly between observations 19 and 24. Generally
speaking, when demand, boarding, and workload scores were decreasing or increasing
between observations, such as in observation four, the crowding level decreased or