
Page 262 - Data Science Algorithms in a Week
P. 262
244 Khaled Alshareef, Ahmad Rahal and Mohammed Basingab
hospital. The hospital operates three eight-hour shifts (day, evening, and night sifts), with
additional resources allocated when crowded (from 10 am to 9 pm). ED process
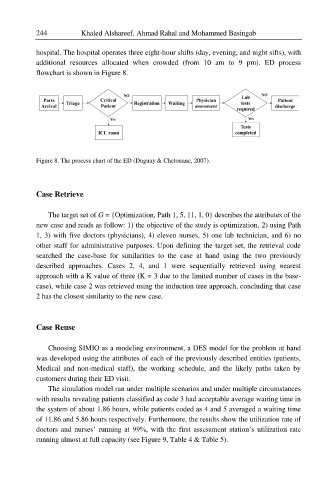
flowchart is shown in Figure 8.
Figure 8. The process chart of the ED (Duguay & Chetouane, 2007).
Case Retrieve
The target set of G = {Optimization, Path 1, 5, 11, 1, 0} describes the attributes of the
new case and reads as follow: 1) the objective of the study is optimization, 2) using Path
1, 3) with five doctors (physicians), 4) eleven nurses, 5) one lab technician, and 6) no
other staff for administrative purposes. Upon defining the target set, the retrieval code
searched the case-base for similarities to the case at hand using the two previously
described approaches. Cases 2, 4, and 1 were sequentially retrieved using nearest
approach with a K value of three (K = 3 due to the limited number of cases in the base-
case), while case 2 was retrieved using the induction tree approach, concluding that case
2 has the closest similarity to the new case.
Case Reuse
Choosing SIMIO as a modeling environment, a DES model for the problem at hand
was developed using the attributes of each of the previously described entities (patients,
Medical and non-medical staff), the working schedule, and the likely paths taken by
customers during their ED visit.
The simulation model ran under multiple scenarios and under multiple circumstances
with results revealing patients classified as code 3 had acceptable average waiting time in
the system of about 1.86 hours, while patients coded as 4 and 5 averaged a waiting time
of 11.86 and 5.86 hours respectively. Furthermore, the results show the utilization rate of
doctors and nurses’ running at 99%, with the first assessment station’s utilization rate
running almost at full capacity (see Figure 9, Table 4 & Table 5).