
Page 263 - Data Science Algorithms in a Week
P. 263
The Utilization of Case-Based Reasoning 245
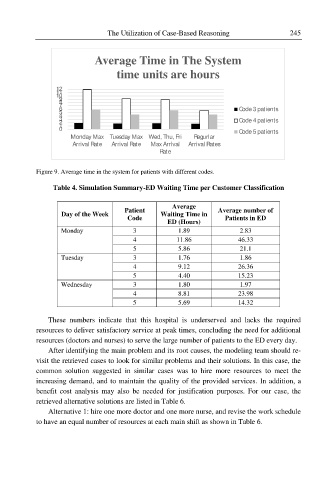
Average Time in The System
time units are hours
12
11
10
9
8
7
6 Code 3 patients
5
4
3 Code 4 patients
2
1
0
Code 5 patients
Monday Max Tuesday Max Wed, Thu, Fri Regurlar
Arrival Rate Arrival Rate Max Arrival Arrival Rates
Rate
Figure 9. Average time in the system for patients with different codes.
Table 4. Simulation Summary-ED Waiting Time per Customer Classification
Average
Patient Average number of
Day of the Week Waiting Time in
Code Patients in ED
ED (Hours)
Monday 3 1.89 2.83
4 11.86 46.33
5 5.86 21.1
Tuesday 3 1.76 1.86
4 9.12 26.36
5 4.40 15.23
Wednesday 3 1.80 1.97
4 8.81 23.98
5 5.69 14.32
These numbers indicate that this hospital is underserved and lacks the required
resources to deliver satisfactory service at peak times, concluding the need for additional
resources (doctors and nurses) to serve the large number of patients to the ED every day.
After identifying the main problem and its root causes, the modeling team should re-
visit the retrieved cases to look for similar problems and their solutions. In this case, the
common solution suggested in similar cases was to hire more resources to meet the
increasing demand, and to maintain the quality of the provided services. In addition, a
benefit cost analysis may also be needed for justification purposes. For our case, the
retrieved alternative solutions are listed in Table 6.
Alternative 1: hire one more doctor and one more nurse, and revise the work schedule
to have an equal number of resources at each main shift as shown in Table 6.