
Page 77 - Prosig Catalogue 2005
P. 77
CONDITION MONITORING
UNDERSTANDING THE IMPORTANCE OF TRANSDUCER ORIENTATION
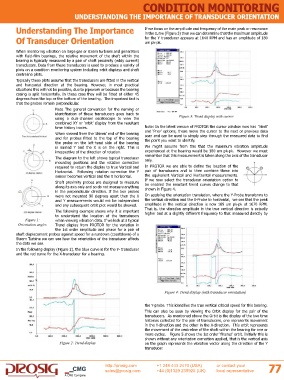
Understanding The Importance If we focus on the amplitude and frequency of the main peak or resonance
in the curve (Figure 3) then we can determine that the maximum amplitude
Of Transducer Orientation for the Y transducer appears at 1640 RPM and has an amplitude of 180
um pk-pk.
When monitoring vibration on large gas or steam turbines and generators
with fluid-film bearings, the relative movement of the shaft within the
bearing is typically measured by a pair of shaft proximity (eddy current)
transducers. Data from these transducers is used to produce a variety of
plots on a condition monitoring system including orbit displays and shaft
centreline plots.
Typically these plots assume that the transducers are fitted in the vertical
and horizontal direction at the bearing. However, in most practical
situations this will not be possible, due to pipework or because the bearing
casing is split horizontally. In these case they will be fitted at either 45
degrees from the top or the bottom of the bearing. The important fact is
that the probes remain perpendicular.
Note The general convention for the naming or
identification of these transducers goes back to Figure 3: Trend display with cursor
using a dual-channel oscilloscope to view the
combined XY or ‘orbit’ display from the resultant
time history traces. Note: In the latest version of PROTOR the cursor window now has ‘Next’
When viewed from the ‘driven’ end of the bearing and ‘Prev’ options, these move the cursor to the next or previous data
scan and can be used to simply step through the measured data to find
and for probes fitted to the top of the bearing the point you want to identify.
the probe on the left-hand side of the bearing
is named Y and the X is on the right. This is We might assume from this that the maximum vibration amplitude
irrespective of the direction of rotation. experienced at the bearing would be 180 um pk-pk. However we must
The diagram to the left shows typical transducer remember that this measurement is taken along the axis of the transducer
only.
mounting positions and the rotation correction
required to return the display to true Vertical and In PROTOR we are able to define the location of the
Horizontal. Following rotation correction the Y pair of transducers and to then combine these into
sensor becomes vertical and the X horizontal. the equivalent Vertical and Horizontal measurements.
Shaft proximity probes are designed to measure If we now select the transducer orientation option to
be enabled the resultant trend curves change to that
along its axis only and so do not measure anything shown in Figure 4.
in the perpendicular direction. If the two probes
were not mounted 90 degrees apart then the X On applying the orientation translation, where the Y-Probe transforms to
and Y measurements would not be independent the vertical direction and the X-Probe to horizontal, we see that the peak
and any subsequent orbit plot would be skewed. amplitude in the vertical direction is now 189 um pk-pk at 1670 RPM.
The following example shows why it is important That is, the vibration amplitude in the true vertical direction is actually
higher and at a slightly different frequency to that measured directly by
to understand the location of the transducers
Figure 1: when viewing vibration data. If we look at a typical
Orientation angles Trend display from PROTOR for the variation in
the 1st order amplitude and phase for a pair of
shaft displacement probes against speed for a rundown (coastdown) of a
Steam Turbine we can see how the orientation of the transducer affects
the data we see.
In the following display (Figure 2), the blue curve is for the Y- transducer
and the red curve for the X-transducer for a bearing.
Figure 4: Trend display (with transducer orientation)
the Y-probe. This identifies the true vertical critical speed for this bearing.
This can also be seen by viewing the Orbit display for the pair of the
transducers. As mentioned above the Orbit is the display of the two time
histories collected for the pair of transducers, one represents movement
in the Y-direction and the other in the X-direction. This orbit represents
the movement of the centreline of the shaft within the bearing for one or
more cycles. Figure 5 shows the 1st order ‘filtered’ orbit. Initially this is
shown without any orientation correction applied, that is the vertical axis
Figure 2: Trend display on the graph represents the vibration vector along the direction of the Y
transducer.
http://prosig.com +1 248 443 2470 (USA) or contact your 77
sales@prosig.com +44 (0)1329 239925 (UK) local representative
A CMG Company