
Page 78 - Prosig Catalogue 2005
P. 78
CONDITION MONITORING
UNDERSTANDING THE IMPORTANCE OF TRANSDUCER ORIENTATION
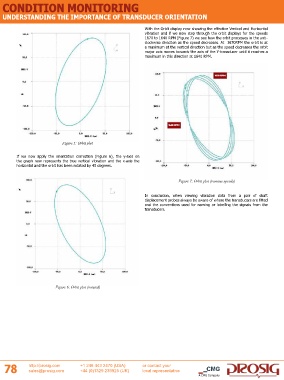
With the Orbit display now showing the effective Vertical and Horizontal
vibration and if we now step through the orbit displays for the speeds
1670 to 1640 RPM (Figure 7) we see how the orbit processes in the anti-
clockwise direction as the speed decreases. At 1670RPM the orbit is at
a maximum at the vertical direction but as the speed decreases the orbit
major axis moves towards the axis of the Y-transducer until it reaches a
maximum in this direction at 1640 RPM.
Figure 5: Orbit plot
If we now apply the orientation correction (Figure 6), the y-axis on
the graph now represents the true vertical vibration and the x-axis the
horizontal and the orbit has been rotated by 45 degrees.
Figure 7: Orbit plot (various speeds)
In conclusion, when viewing vibration data from a pair of shaft
displacement probes always be aware of where the transducers are fitted
and the conventions used for naming or labelling the signals from the
transducers.
Figure 6: Orbit plot (rotated)
78 http://prosig.com +1 248 443 2470 (USA) or contact your
+44 (0)1329 239925 (UK) local representative
sales@prosig.com
A CMG Company