
Page 39 - BANKING FINANCE JANUARY 2016 ONLINE
P. 39
ARTICLE
percentage of total defaulters among the same borrowers 4. Causes for NPAs
in the canal and non-canal region were 24.84 among the
marginal farmers, 33.79 among the small farmers, 23.44 There are a multiplicity of causes for loan default among
among the medium farmers, and 17.93 among the large the different categories of farmers. The reasons for
farmers. Paired sample t-test is applied to calculate t- default are also quite varied. The data collected from the
value in canal and non-canal regions. The t-value for the sample investigation regarding defaulters has been
canal region 3.147, which is significant at 5 per cent level. summarized into six categories following the model of
Similarly, the t-value for non-canal region is 6.301, which Nirmal Sande Rathne(1). The reasons for default are
significant at 1 per cent level. classified into 6 categories as shown in table 2.
In the canal region 32.86 per cent of the defaulters were a. Defects in Farm Production
illiterates, 34.29 per cent had primary education, 30 per Poor productive conditions of the farming enterprise
cent had secondary education, and 2.86 per cent had often make it difficult to repay. This defect is
college education. In the non-canal region 38.67 per cent also expressed in terms of "non-viable farm units",
of the defaulters were illiterates, 32 per cent had primary which often refers to the small size of farms. The
education, 26.67 had secondary education and 2.66 per implication is that farmers are unable but willing to
cent had college education. repay.
The total percentage of illiterate defaulters was 35.86, The data shows that defects in farm production one
33.1 per cent among those with primary education, 28.27 of the important factors to which 14.28 per cent of
per cent among those with secondary education and 2.77 the respondents attributed their default and the
per cent among those with college education in both the default amount was 10.5 per cent. In non-canal
canal and non-canal region. The t-value for the canal region the percentage of defaulters for the same
region is 4.636 and non-canal region is 3.326 which is region was 22.67 per cent and 22.25 per cent of the
significant at 5 per cent level in both regions. loan amount was defaulted.
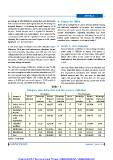
Table - 2
Category wise defaulters and the amount defaulted
Canal region Non-Canal region
S. Category of No. of Percentage Amount Percentage No. of Percentage Amount Percentage
No. defaulters defaulters of amount defaulters of amount
of defaulted defaulted of defaulted defaulted
17
defaulters Rs. 10.50 defaulters Rs. 22.25
1. Defects in farm 10 14.28 4,86,675 22.67 10,51090
production 16
8 22.86 9,77,985 21.10 14 18.67 14,73,888 31.20
2. Variability in
incomes 10 11.43 6,99,424 15.09 6 8.00 3,89,730 8.25
17
3. Defects in the 9 14.29 4,24,100 9.15 10 13.33 5,66,880 12.00
credit 70
organization 24.28 11,38,356 24.56 15 20.00 10,15,660 21.50
12.86 9,08,460
4. Attitudinal 100 46,35,000 19.60 13 17.33 2,26,752 4.80
conditions
100 75 100 47,24,000 100
5. Misallocation
6. Miscellaneous
Total
Source : Field data.
BANKING FINANCE | JANUARY | 2016 | 39
Copyright@ The Insurance Times. 09883398055 / 09883380339