
Page 380 - Divyank Tyagi
P. 380
346 | ChApter 9 ConCeptual Design anD Design analysis
This will take a few minutes to run. Your model data will be sent off to their cloud for
processing and allow you to continue working while the analysis is being performed.
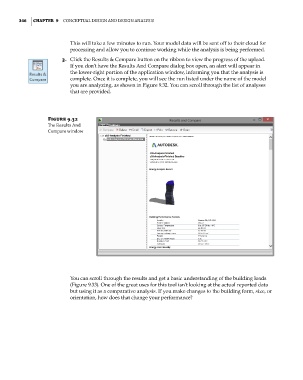
3. Click the Results & Compare button on the ribbon to view the progress of the upload.
If you don’t have the Results And Compare dialog box open, an alert will appear in
the lower-right portion of the application window, informing you that the analysis is
complete. Once it is complete, you will see the run listed under the name of the model
you are analyzing, as shown in Figure 9.32. You can scroll through the list of analyses
that are provided.
Figure 9.32
The results and
Compare window
You can scroll through the results and get a basic understanding of the building loads
(Figure 9.33). One of the great uses for this tool isn’t looking at the actual reported data
but using it as a comparative analysis. If you make changes to the building form, size, or
orientation, how does that change your performance?
c09.indd 346 5/3/2014 11:01:10 AM