
Page 866 - Divyank Tyagi
P. 866
832 | ChaPter 20 Presenting Your Design
Using Numerical ranges for Color Schemes
In the previous exercises, you explored how to utilize color schemes to create presentation
material based on specific object properties. You can also create color schemes that display
ranges of numerical values. In the following exercise, you will continue with the c20-Sample-
Building2-Start.rvt or c20-Sample-Metric2-Start.rvt file. With the Room color fill
legend defined, you have seen an example of how to create color fill legends. A variety of
other legend types are available, and some of these types allow you to define your own
parameters when creating the legend itself. Let’s step through this process again using a
different legend type so you can see how you can define your own parameters in a color fill
legend.
The next color scheme you will create is based on areas. Whereas the Department color
scheme was defined by rooms that were already placed on plans, the area scheme is defined
by numerical ranges you will need to define within the color scheme properties. Follow these
steps:
1. In the Project Browser, right-click the Level 1 - Dept - Black floor plan and choose
Duplicate With Detailing from the context menu. Rename the duplicated plan Level 1
– Area Range. Select the color fill legend in the view, and click Edit Scheme in the contex-
tual tab of the ribbon.
2. In the Edit Color Scheme dialog box, create a copy of the Name color scheme, using the
Duplicate icon at the bottom of the list. Name the new scheme Area Range. Also change
the Title field to Area Range.
3. From the Color drop-down list, choose Area. Click OK if you are presented with a warn-
ing about preserving colors.
You’ll notice that all the room names and colors will disappear; they are replaced with
values representing each unique room area.
This type of schedule—like a schedule of room names—is probably not that useful as a
presentation method. Instead, let’s create a series of colored area ranges to easily identify
which spaces are within specific ranges.
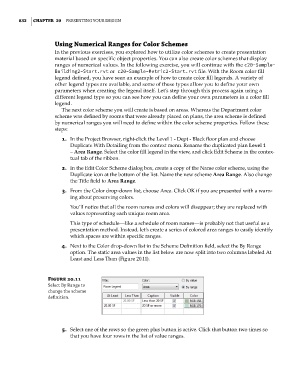
4. Next to the Color drop-down list in the Scheme Definition field, select the By Range
option. The static area values in the list below are now split into two columns labeled At
Least and Less Than (Figure 20.11).
Figure 20.11
select By range to
change the scheme
definition.
5. Select one of the rows so the green plus button is active. Click that button two times so
that you have four rows in the list of value ranges.
c20.indd 832 5/3/2014 11:59:59 AM