
Page 35 - A Level Business Studies - Financial Analysis Tasks
P. 35
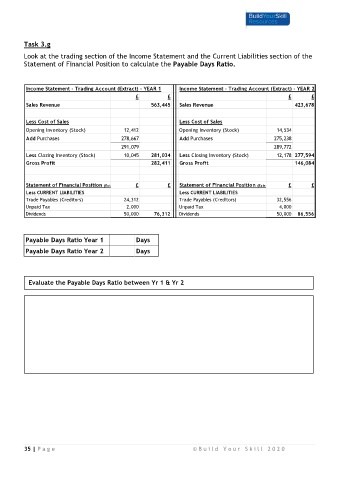
Task 3.g
         Look at the trading section of the Income Statement and the Current Liabilities section of the
         Statement of Financial Position to calculate the Payable Days Ratio.


          Income Statement - Trading Account (Extract) - YEAR 1  Income Statement - Trading Account (Extract) - YEAR 2
                                                 £          £                                         £       £
          Sales Revenue                               563,445   Sales Revenue                            423,678


          Less Cost of Sales                                    Less Cost of Sales
          Opening Inventory (Stock)          12,412             Opening Inventory (Stock)         14,534
          Add Purchases                     278,667             Add Purchases                    275,238
                                            291,079                                              289,772
          Less Closing Inventory (Stock)     10,045   281,034   Less Closing Inventory (Stock)    12,178 277,594
          Gross Profit                                282,411   Gross Profit                             146,084


          Statement of Financial Position (Extract)  £      £   Statement of Financial Position (Extract)  £  £
          Less CURRENT LIABILITIES                              Less CURRENT LIABILITIES
          Trade Payables (Creditors)         24,312             Trade Payables (Creditors)        32,556
          Unpaid Tax                         2,000              Unpaid Tax                         4,000
          Dividends                          50,000    76,312   Dividends                         50,000  86,556


           Payable Days Ratio Year 1             Days

          Payable Days Ratio Year 2              Days


           Evaluate the Payable Days Ratio between Yr 1 & Yr 2


          35 | P a g e                                               © B u i l d   Y o u r   S k i l l   2 0 2 0