
Page 36 - A Level Business Studies - Financial Analysis Tasks
P. 36
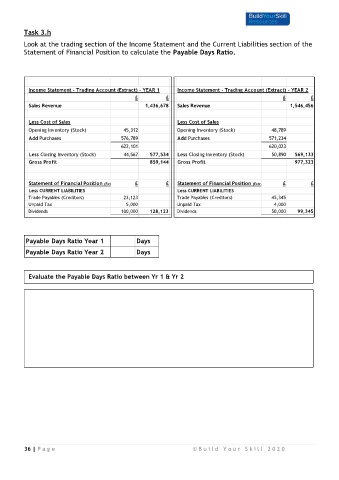
Task 3.h

         Look at the trading section of the Income Statement and the Current Liabilities section of the
         Statement of Financial Position to calculate the Payable Days Ratio.


           Income Statement - Trading Account (Extract) - YEAR 1  Income Statement - Trading Account (Extract) - YEAR 2
                                                 £         £                                        £         £

            Sales Revenue                           1,436,678  Sales Revenue                           1,546,456
            Less Cost of Sales                                 Less Cost of Sales

            Opening Inventory (Stock)       45,312             Opening Inventory (Stock)        48,789
           Add Purchases                    576,789            Add Purchases                    571,234
                                            622,101                                             620,023
            Less Closing Inventory (Stock)  44,567    577,534  Less Closing Inventory (Stock)   50,890   569,133
           Gross Profit                               859,144  Gross Profit                              977,323


           Statement of Financial Position (Extract)  £    £   Statement of Financial Position (Extract)  £   £
            Less CURRENT LIABILITIES                           Less CURRENT LIABILITIES
           Trade Payables (Creditors)       23,123             Trade Payables (Creditors)       45,345
           Unpaid Tax                        5,000             Unpaid Tax                        4,000
           Dividends                        100,000   128,123  Dividends                        50,000    99,345


           Payable Days Ratio Year 1             Days
           Payable Days Ratio Year 2             Days


            Evaluate the Payable Days Ratio between Yr 1 & Yr 2


          36 | P a g e                                               © B u i l d   Y o u r   S k i l l   2 0 2 0