
Page 41 - A Level Business Studies - Financial Analysis Tasks
P. 41
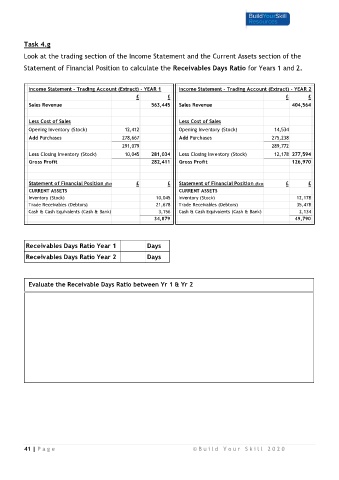
Task 4.g
         Look at the trading section of the Income Statement and the Current Assets section of the

         Statement of Financial Position to calculate the Receivables Days Ratio for Years 1 and 2.


            Income Statement - Trading Account (Extract) - YEAR 1  Income Statement - Trading Account (Extract) - YEAR 2
                                                 £          £                                        £       £
           Sales Revenue                              563,445   Sales Revenue                           404,564

           Less Cost of Sales                                   Less Cost of Sales
            Opening Inventory (Stock)        12,412             Opening Inventory (Stock)        14,534

            Add Purchases                   278,667             Add Purchases                   275,238
                                            291,079                                             289,772
            Less Closing Inventory (Stock)   10,045   281,034   Less Closing Inventory (Stock)   12,178 277,594

            Gross Profit                              282,411   Gross Profit                            126,970


            Statement of Financial Position (Extract)  £    £   Statement of Financial Position (Extract)  £  £
           CURRENT ASSETS                                       CURRENT ASSETS
            Inventory (Stock)                           10,045  Inventory (Stock)                        12,178
           Trade Receivables (Debtors)                  21,678  Trade Receivables (Debtors)              35,478
           Cash & Cash Equivalents (Cash & Bank)         3,156  Cash & Cash Equivalents (Cash & Bank)     2,134
                                                       34,879                                            49,790


           Receivables Days Ratio Year 1             Days

           Receivables Days Ratio Year 2             Days


            Evaluate the Receivable Days Ratio between Yr 1 & Yr 2


          41 | P a g e                                               © B u i l d   Y o u r   S k i l l   2 0 2 0