
Page 42 - A Level Business Studies - Financial Analysis Tasks
P. 42
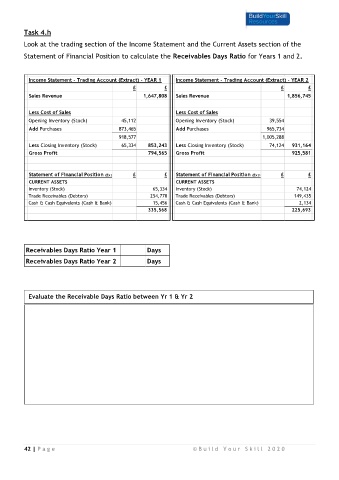
Task 4.h

         Look at the trading section of the Income Statement and the Current Assets section of the
         Statement of Financial Position to calculate the Receivables Days Ratio for Years 1 and 2.


           Income Statement - Trading Account (Extract) - YEAR 1  Income Statement - Trading Account (Extract) - YEAR 2
                                                £          £                                        £        £

           Sales Revenue                           1,647,808   Sales Revenue                          1,856,745

            Less Cost of Sales                                 Less Cost of Sales
           Opening Inventory (Stock)        45,112             Opening Inventory (Stock)        39,554
           Add Purchases                   873,465             Add Purchases                   965,734
                                           918,577                                           1,005,288
           Less Closing Inventory (Stock)   65,334   853,243   Less Closing Inventory (Stock)   74,124  931,164
           Gross Profit                              794,565   Gross Profit                             925,581


            Statement of Financial Position (Extract)  £   £   Statement of Financial Position (Extract)  £  £
           CURRENT ASSETS                                      CURRENT ASSETS
           Inventory (Stock)                           65,334  Inventory (Stock)                         74,124
            Trade Receivables (Debtors)               254,778  Trade Receivables (Debtors)              149,435
           Cash & Cash Equivalents (Cash & Bank)       15,456  Cash & Cash Equivalents (Cash & Bank)      2,134
                                                     335,568                                            225,693


           Receivables Days Ratio Year 1             Days

           Receivables Days Ratio Year 2             Days


            Evaluate the Receivable Days Ratio between Yr 1 & Yr 2


          42 | P a g e                                               © B u i l d   Y o u r   S k i l l   2 0 2 0