
Page 48 - A Level Business Studies - Financial Analysis Tasks
P. 48
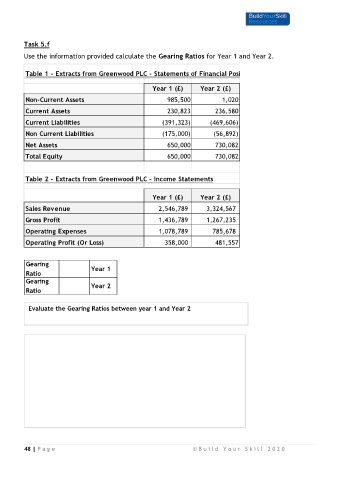
Task 5.f
         Use the information provided calculate the Gearing Ratios for Year 1 and Year 2.


          Table 1 - Extracts from Greenwood PLC - Statements of Financial Position

                                                       Year 1 (£)      Year 2 (£)

          Non-Current Assets                                985,500            1,020

          Current Assets                                    230,823          236,580

          Current Liabilities                             (391,323)        (469,606)

          Non Current Liabilities                         (175,000)         (56,892)

          Net Assets                                        650,000          730,082

          Total Equity                                      650,000          730,082


          Table 2 - Extracts from Greenwood PLC - Income Statements


                                                       Year 1 (£)      Year 2 (£)
           Sales Revenue                                    2,546,789         3,324,567

           Gross Profit                                     1,436,789         1,267,235
          Operating Expenses                                1,078,789           785,678

          Operating Profit (Or Loss)                          358,000        481,557


          Gearing
           Ratio                 Year 1

           Gearing               Year 2
          Ratio

            Evaluate the Gearing Ratios between year 1 and Year 2


          48 | P a g e                                               © B u i l d   Y o u r   S k i l l   2 0 2 0