
Page 777 - Mechatronics with Experiments
P. 777
LABORATORY EXPERIMENTS 763
Amplitude ratio (Output signal/input signal)
response
Transition
Pass band band
1
0.707
Stop band
Idealized
response
0
f c Frequency
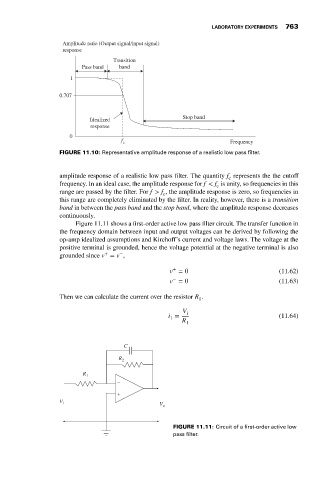
FIGURE 11.10: Representative amplitude response of a realistic low pass filter.
amplitude response of a realistic low pass filter. The quantity f represents the the cutoff
c
frequency. In an ideal case, the amplitude response for f < f is unity, so frequencies in this
c
range are passed by the filter. For f > f , the amplitude response is zero, so frequencies in
c
this range are completely eliminated by the filter. In reality, however, there is a transition
band in between the pass band and the stop band, where the amplitude response decreases
continuously.
Figure 11.11 shows a first-order active low pass filter circuit. The transfer function in
the frequency domain between input and output voltages can be derived by following the
op-amp idealized assumptions and Kirchoff’s current and voltage laws. The voltage at the
positive terminal is grounded, hence the voltage potential at the negative terminal is also
−
+
grounded since v = v ,
+
v = 0 (11.62)
−
v = 0 (11.63)
Then we can calculate the current over the resistor R .
1
V i
i = (11.64)
1
R 1
C
R 2
R 1
–
+
V i
V
o
FIGURE 11.11: Circuit of a first-order active low
pass filter.