Page 775 - Mechatronics with Experiments
P. 775

LABORATORY EXPERIMENTS  761


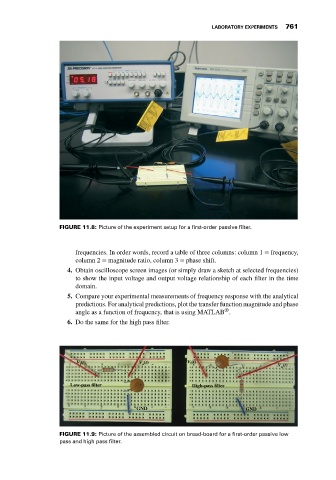
                             FIGURE 11.8: Picture of the experiment setup for a first-order passive filter.


                                  frequencies. In order words, record a table of three columns: column 1 = frequency,
                                  column 2 = magnitude ratio, column 3 = phase shift.
                                4. Obtain oscilloscope screen images (or simply draw a sketch at selected frequencies)
                                  to show the input voltage and output voltage relationship of each filter in the time
                                  domain.
                                5. Compare your experimental measurements of frequency response with the analytical
                                  predictions. For analytical predictions, plot the transfer function magnitude and phase
                                                                               ®
                                  angle as a function of frequency, that is using MATLAB .
                                6. Do the same for the high pass filter.


                                   V (t)             V (t)          V (t)                      V (t)
                                                                     i
                                                      o
                                    i
                                                                                                o
                                 Low-pass filter                     High-pass filter


                                                    GND                              GND


                             FIGURE 11.9: Picture of the assembled circuit on bread-board for a first-order passive low
                             pass and high pass filter.
   770   771   772   773   774   775   776   777   778   779   780