
Page 170 - Servo Motors and Industrial Control Theory -
P. 170
166 Appendix A
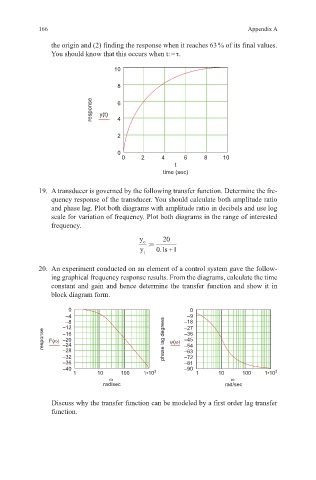
the origin and (2) finding the response when it reaches 63 % of its final values.
You should know that this occurs when t: = τ.
10
8
response y(t) 6
4
2
0
0 2 4 6 8 10
t
time (sec)
19. A transducer is governed by the following transfer function. Determine the fre-
quency response of the transducer. You should calculate both amplitude ratio
and phase lag. Plot both diagrams with amplitude ratio in decibels and use log
scale for variation of frequency. Plot both diagrams in the range of interested
frequency.
y o := 20
. +
y 01 s 1
i
20. An experiment conducted on an element of a control system gave the follow-
ing graphical frequency response results. From the diagrams, calculate the time
constant and gain and hence determine the transfer function and show it in
block diagram form.
0 0
–4 –9
–8 –18
–12 –27
response F(ω) –16 phase lag degrees ψ(ω) –36
–45
–20
–24
–54
–28
–32 –63
–72
–36 –81
–40 3 –90 3
1 10 100 1•10 1 10 100 1•10
ω ω
rad/sec rad/sec
Discuss why the transfer function can be modeled by a first order lag transfer
function.