
Page 171 - Servo Motors and Industrial Control Theory -
P. 171
Appendix A 167
21. A system is governed by the following second order lag transfer function.
Determine the natural frequency and damping ratio and the steady state gain.
Sketch the step input response by finding several important points. Plot the fre-
quency response for the interested frequency range. You may use the MathCad
or other mathematical software.
y o := 100
y 0.01 s⋅ 2 + 0.02s 1+
i
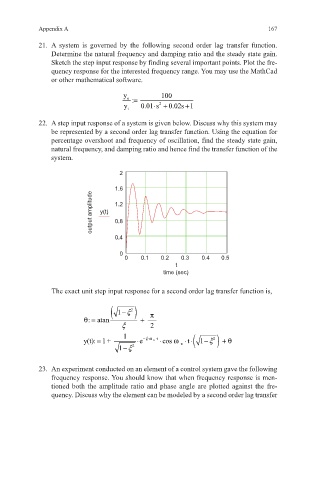
22. A step input response of a system is given below. Discuss why this system may
be represented by a second order lag transfer function. Using the equation for
percentage overshoot and frequency of oscillation, find the steady state gain,
natural frequency, and damping ratio and hence find the transfer function of the
system.
2
1.6
output amplitude y(t) 1.2
0.8
0.4
0
0 0.1 0.2 0.3 0.4 0.5
t
time (sec)
The exact unit step input response for a second order lag transfer function is,
( 1 ξ− 2 )
θ= + π
: atan
ξ 2
1
−
y(t): 1 += e ⋅ − ξ⋅ω n t ⋅ ⋅ cos ω ⋅ ⋅ ( 1 ξ 2 ) +θ
t
n
1 ξ 2
−
23. An experiment conducted on an element of a control system gave the following
frequency response. You should know that when frequency response is men-
tioned both the amplitude ratio and phase angle are plotted against the fre-
quency. Discuss why the element can be modeled by a second order lag transfer