
Page 246 - DNBI_A01.QXD
P. 246
223
At all times, remember to apply affirmative evaluation – train yourself 6 : STEP FOUR – PLANNING FOR IMPLEMENTATION
to identify the good aspects in every idea, however apparently
outlandish, before you criticise it.
fishbone analysis Developed by Professor Kaoru Ishikawa, so-called
fishbone analysis is an effective way of exploring the relationship
between cause and effect.
On your writing surface, draw a long arrow horizontally across the page to
represent the backbone of the fish. At the right-hand side, write down the
potential block to implementation – this is the head of the fish. Next, you
should draw fishbones at roughly 45° from the backbone to identify the
likely major causes of the potential block. Once you have done this, draw
further small bones off each of the major causes to mark further
breakdowns of each cause. Highlight any causes that appear more than
once because they may have a particular significance. Circle anything that
seems to be a ‘key’ cause, so that you can concentrate on it subsequently.
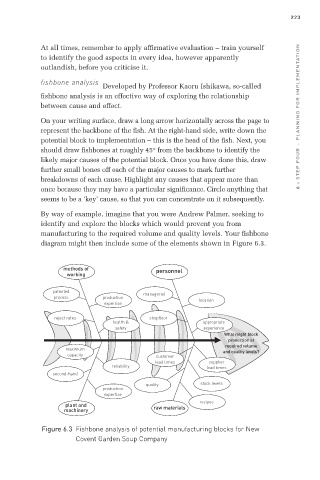
By way of example, imagine that you were Andrew Palmer, seeking to
identify and explore the blocks which would prevent you from
manufacturing to the required volume and quality levels. Your fishbone
diagram might then include some of the elements shown in Figure 6.3.
methods of personnel
working
patented production managerial
process expertise
location
reject rates health &
safety shopfloor appropriate
maximum experience
capacity reliability customer
second-hand lead times What might block
production quality production at
plant and expertise
machinery required volume
and quality levels?
supplier
lead times
stock levels
recipes
raw materials
Figure 6.3 Fishbone analysis of potential manufacturing blocks for New
Covent Garden Soup Company