
Page 138 - The Sales Acceleration Formula: Using Data, Technology, and Inbound Selling to go from $0 to $100 Million - PDFDrive.com
P. 138
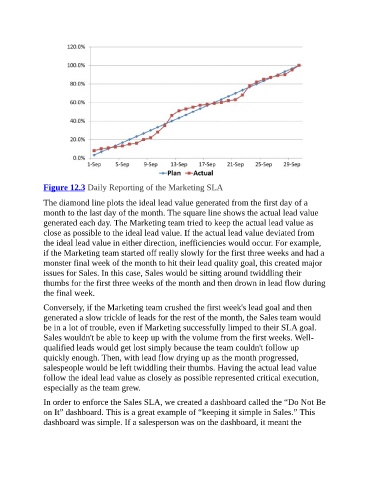
Figure	12.3	Daily	Reporting	of	the	Marketing	SLA

The	diamond	line	plots	the	ideal	lead	value	generated	from	the	first	day	of	a
month	to	the	last	day	of	the	month.	The	square	line	shows	the	actual	lead	value
generated	each	day.	The	Marketing	team	tried	to	keep	the	actual	lead	value	as
close	as	possible	to	the	ideal	lead	value.	If	the	actual	lead	value	deviated	from
the	ideal	lead	value	in	either	direction,	inefficiencies	would	occur.	For	example,
if	the	Marketing	team	started	off	really	slowly	for	the	first	three	weeks	and	had	a
monster	final	week	of	the	month	to	hit	their	lead	quality	goal,	this	created	major
issues	for	Sales.	In	this	case,	Sales	would	be	sitting	around	twiddling	their
thumbs	for	the	first	three	weeks	of	the	month	and	then	drown	in	lead	flow	during
the	final	week.

Conversely,	if	the	Marketing	team	crushed	the	first	week's	lead	goal	and	then
generated	a	slow	trickle	of	leads	for	the	rest	of	the	month,	the	Sales	team	would
be	in	a	lot	of	trouble,	even	if	Marketing	successfully	limped	to	their	SLA	goal.
Sales	wouldn't	be	able	to	keep	up	with	the	volume	from	the	first	weeks.	Well-
qualified	leads	would	get	lost	simply	because	the	team	couldn't	follow	up
quickly	enough.	Then,	with	lead	flow	drying	up	as	the	month	progressed,
salespeople	would	be	left	twiddling	their	thumbs.	Having	the	actual	lead	value
follow	the	ideal	lead	value	as	closely	as	possible	represented	critical	execution,
especially	as	the	team	grew.

In	order	to	enforce	the	Sales	SLA,	we	created	a	dashboard	called	the	“Do	Not	Be
on	It”	dashboard.	This	is	a	great	example	of	“keeping	it	simple	in	Sales.”	This
dashboard	was	simple.	If	a	salesperson	was	on	the	dashboard,	it	meant	the