
Page 77 - The Sales Acceleration Formula: Using Data, Technology, and Inbound Selling to go from $0 to $100 Million - PDFDrive.com
P. 77
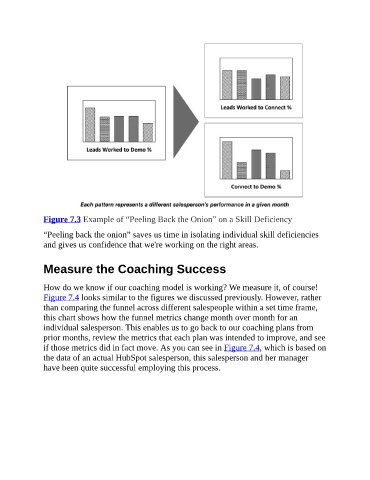
Figure	7.3	Example	of	“Peeling	Back	the	Onion”	on	a	Skill	Deficiency

“Peeling	back	the	onion”	saves	us	time	in	isolating	individual	skill	deficiencies
and	gives	us	confidence	that	we're	working	on	the	right	areas.

Measure	the	Coaching	Success

How	do	we	know	if	our	coaching	model	is	working?	We	measure	it,	of	course!
Figure	7.4	looks	similar	to	the	figures	we	discussed	previously.	However,	rather
than	comparing	the	funnel	across	different	salespeople	within	a	set	time	frame,
this	chart	shows	how	the	funnel	metrics	change	month	over	month	for	an
individual	salesperson.	This	enables	us	to	go	back	to	our	coaching	plans	from
prior	months,	review	the	metrics	that	each	plan	was	intended	to	improve,	and	see
if	those	metrics	did	in	fact	move.	As	you	can	see	in	Figure	7.4,	which	is	based	on
the	data	of	an	actual	HubSpot	salesperson,	this	salesperson	and	her	manager
have	been	quite	successful	employing	this	process.