
Page 73 - The Sales Acceleration Formula: Using Data, Technology, and Inbound Selling to go from $0 to $100 Million - PDFDrive.com
P. 73
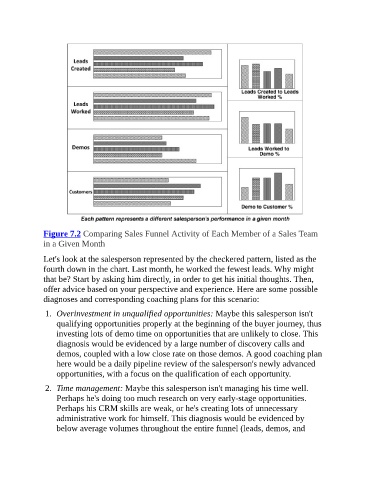
Figure	7.2	Comparing	Sales	Funnel	Activity	of	Each	Member	of	a	Sales	Team
in	a	Given	Month

Let's	look	at	the	salesperson	represented	by	the	checkered	pattern,	listed	as	the
fourth	down	in	the	chart.	Last	month,	he	worked	the	fewest	leads.	Why	might
that	be?	Start	by	asking	him	directly,	in	order	to	get	his	initial	thoughts.	Then,
offer	advice	based	on	your	perspective	and	experience.	Here	are	some	possible
diagnoses	and	corresponding	coaching	plans	for	this	scenario:

1.	 Overinvestment	in	unqualified	opportunities:	Maybe	this	salesperson	isn't
    qualifying	opportunities	properly	at	the	beginning	of	the	buyer	journey,	thus
    investing	lots	of	demo	time	on	opportunities	that	are	unlikely	to	close.	This
    diagnosis	would	be	evidenced	by	a	large	number	of	discovery	calls	and
    demos,	coupled	with	a	low	close	rate	on	those	demos.	A	good	coaching	plan
    here	would	be	a	daily	pipeline	review	of	the	salesperson's	newly	advanced
    opportunities,	with	a	focus	on	the	qualification	of	each	opportunity.

2.	 Time	management:	Maybe	this	salesperson	isn't	managing	his	time	well.
    Perhaps	he's	doing	too	much	research	on	very	early-stage	opportunities.
    Perhaps	his	CRM	skills	are	weak,	or	he's	creating	lots	of	unnecessary
    administrative	work	for	himself.	This	diagnosis	would	be	evidenced	by
    below	average	volumes	throughout	the	entire	funnel	(leads,	demos,	and