
Page 10 - Play Works Impact Report 2025
P. 10
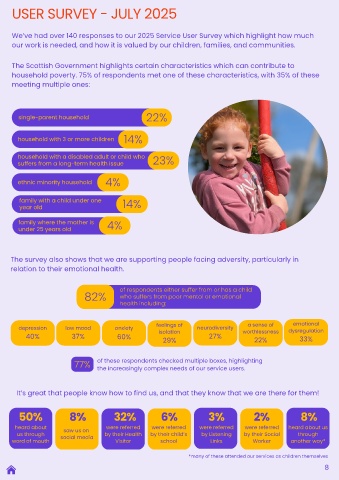
USER SURVEY - JULY 2025


     We’ve had over 140 responses to our 2025 Service User Survey which highlight how much
     our work is needed, and how it is valued by our children, families, and communities.


     The Scottish Government highlights certain characteristics which can contribute to
     household poverty. 75% of respondents met one of these characteristics, with 35% of these
     meeting multiple ones:


                                                    22%
       single-parent household


       household with 3 or more children     14%

       household with a disabled adult or child who    23%
       suffers from a long-term health issue

                                      4%
       ethnic minority household


        family with a child under one       14%
        year old

       family where the mother is      4%
       under 25 years old


     The survey also shows that we are supporting people facing adversity, particularly in
     relation to their emotional health.


                                           of respondents either suffer from or has a child
                               82%         who suffers from poor mental or emotional
                                           health including:


                                                                                                        emotional
                                                                                        a sense of
        depression      low mood         anxiety        feelings of   neurodiversity  worthlessness   dysregulation
                                                         isolation
          40%             37%             60%             29%             27%             22%             33%


                           77%     of these respondents checked multiple boxes, highlighting
                                   the increasingly complex needs of our service users.


       It’s great that people know how to find us, and that they know that we are there for them!


        50%              8%              32%              6%              3%              2%               8%

      heard about      saw us on      were referred   were referred    were referred   were referred  heard about us
       us through                     by their Health  by their child’s  by Listening  by their Social    through
     word of mouth    social media        Visitor        school            Links          Worker       another way*

                                                                   *many of these attended our services as children themselves
                                                                                                                   8